Average Order Value (AOV) is a critical metric for understanding customer spending habits in your Shopify store. It encompasses all expenditures including shipping, taxes, and other fees associated with a purchase. For store owners not focused on complex financial reporting, looking into AOV based on actual customer expenditure provides straightforward, actionable data. This post delves into how understanding AOV distributions, rather than just averages, can revolutionize your sales strategy.
What's AOV and Its Definition
Average Order Value (AOV) is a key metric used by e-commerce businesses to measure the average amount spent each time a customer places an order within a specific period. AOV is calculated by dividing the total revenue by the number of orders, providing insights into the overall effectiveness of your marketing and pricing strategies. This metric includes all related expenditures such as shipping costs, taxes, and any other fees that contribute to the total cost of an order.
Understanding AOV is crucial for e-commerce store owners, particularly those who might not be inclined to delve into detailed financial reporting. Instead of focusing solely on total sales or the number of transactions, AOV offers a per-transaction perspective that highlights the spending behavior of customers. By analyzing AOV, store owners can gauge the economic value of each customer interaction and identify opportunities to enhance the value of each purchase.
For instance, if you’re operating a Shopify store and choose not to set up comprehensive financial reports, focusing on AOV can provide a simpler, yet effective, approach to understanding how much customers are spending on average. This understanding is vital for making informed decisions about pricing strategies, marketing campaigns, and product offerings. It allows you to strategically adjust aspects of your business to encourage customers to spend more per order, thereby increasing the overall profitability without necessarily increasing the number of customers.
Detailed Insights from the "AOV distributions" Report
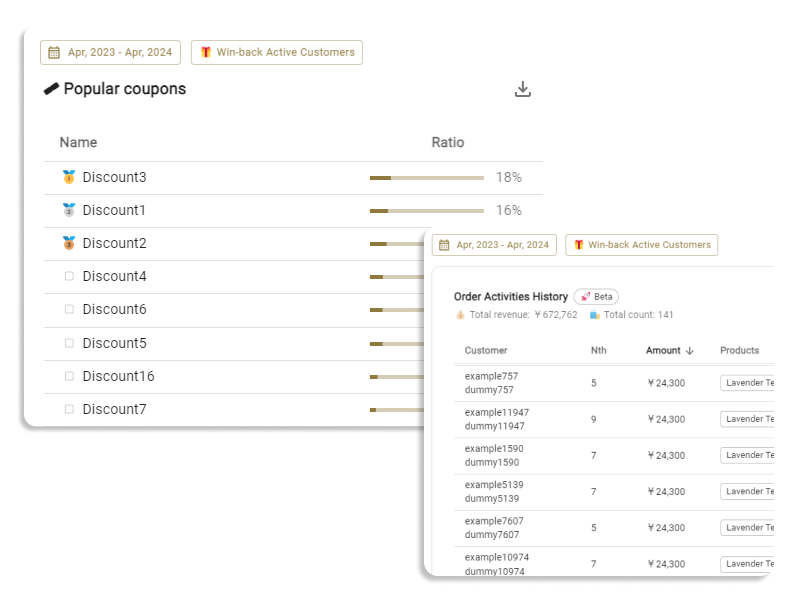
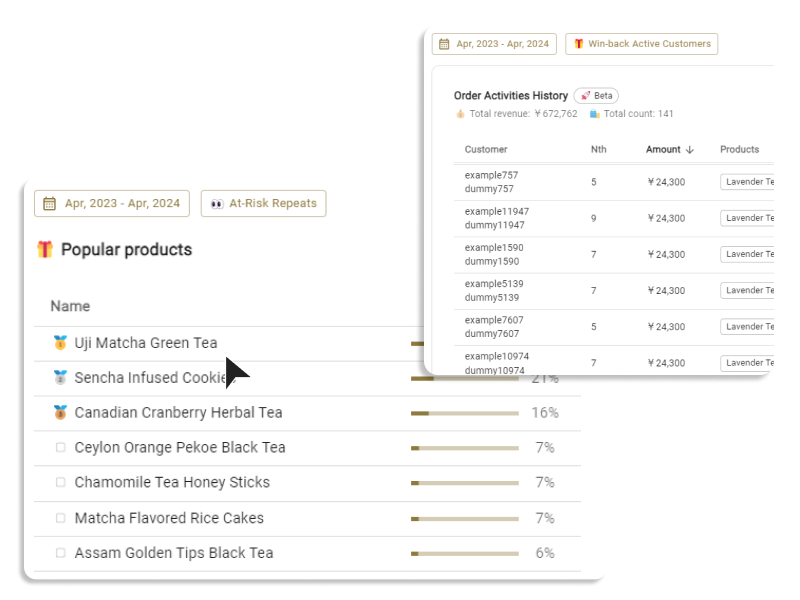
Understanding AOV through its distribution is essential because it provides a more nuanced view of how different customer segments interact with your store. The 'AOV Distributions' report simplifies this complex data into an understandable format, enabling you to grasp the real dynamics of customer spending.
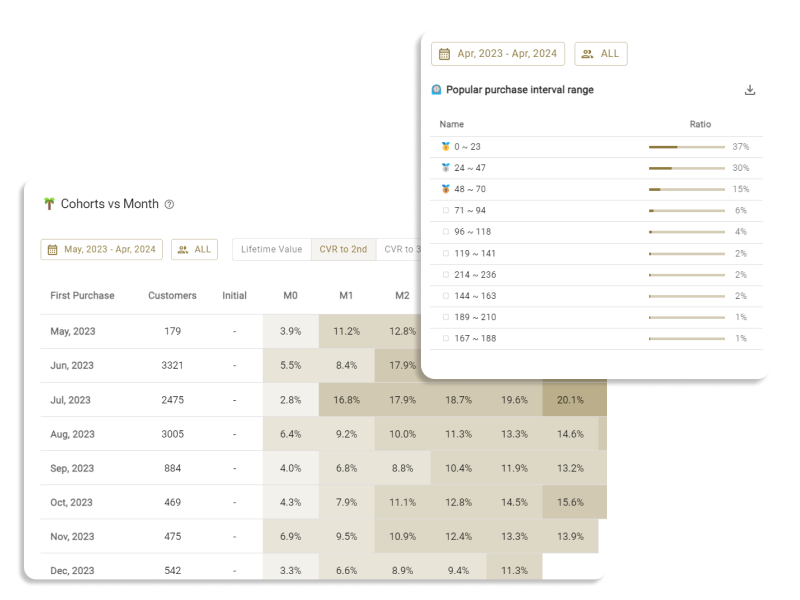
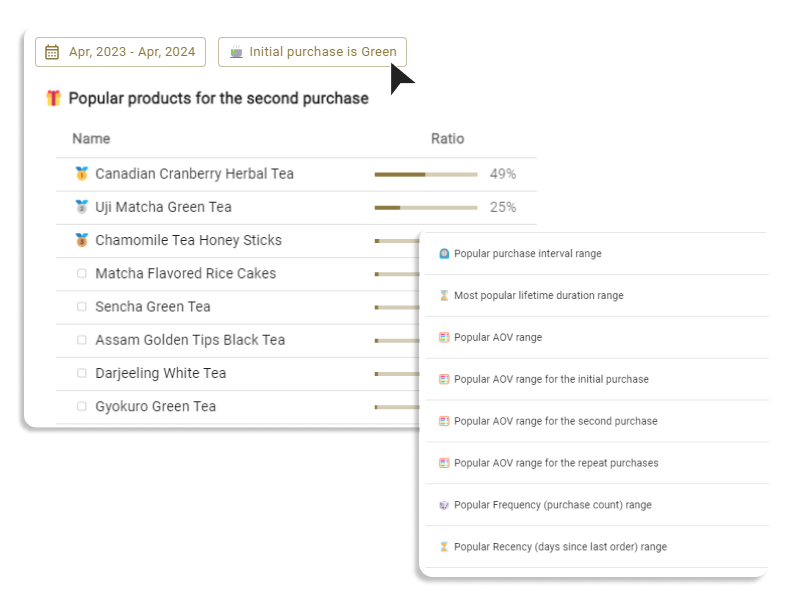
🧮 Popular AOV ranges
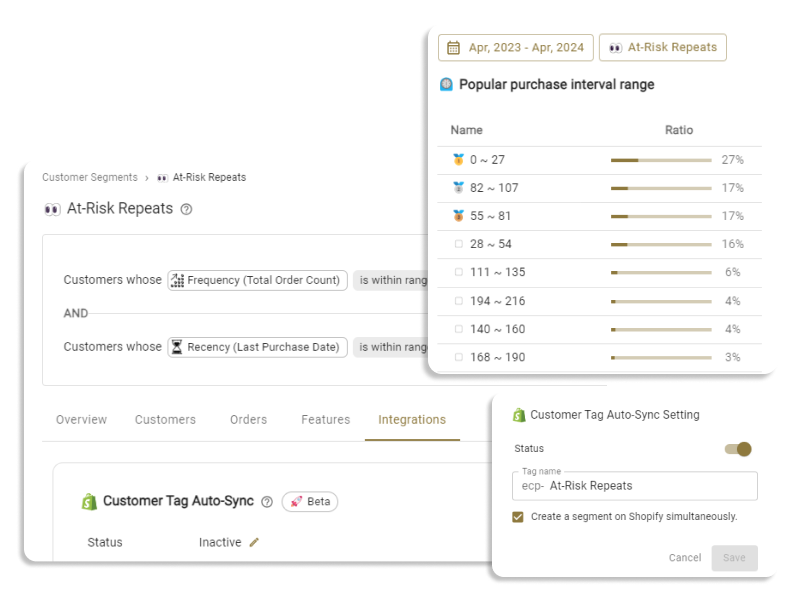
This report section delves into the distribution of average order values across your customer base, employing a methodical approach to ensure data clarity and usefulness. By excluding the top and bottom 5% of data, it avoids skewing caused by outliers, ensuring a more accurate representation of typical customer behavior. The remaining data is then segmented into deciles. Each decile represents a range of AOV, and these ranges are then analyzed and ranked according to the frequency of customer transactions within those ranges. This structured approach allows store owners to clearly see which AOV brackets are most prevalent among their customers, informing strategies to optimize pricing, promotions, and product placement.
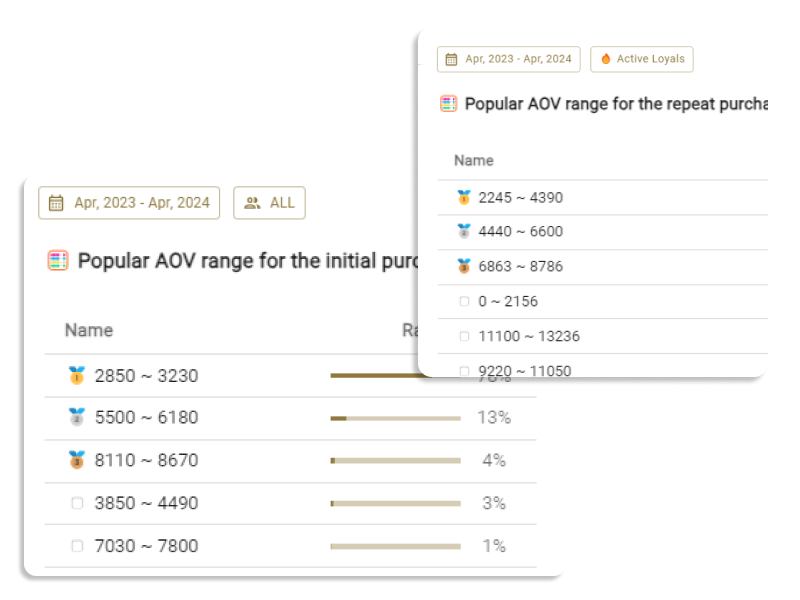
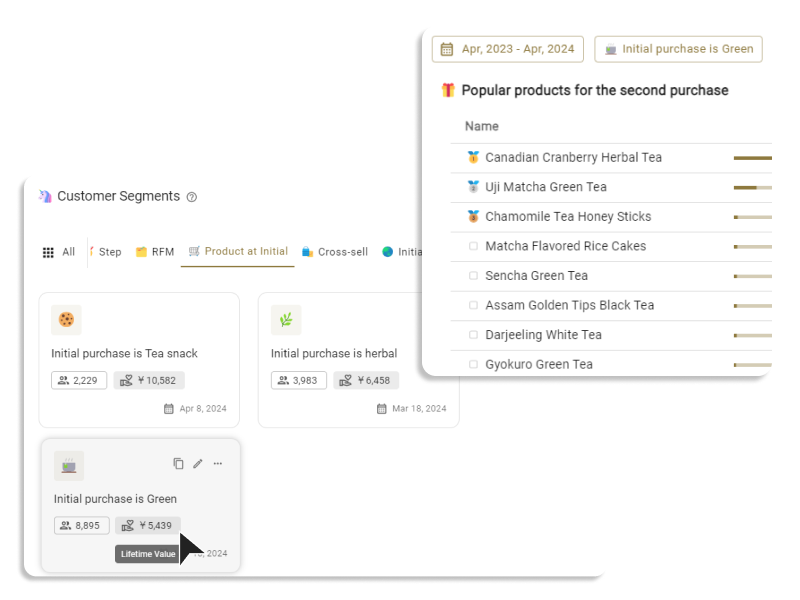
🧮 Popular AOV ranges for the initial purchase
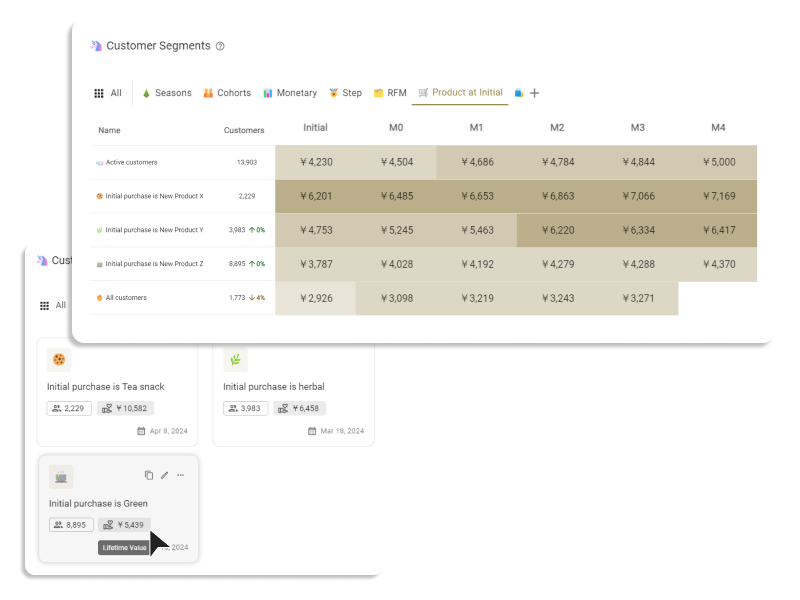
Focusing on the initial purchase, this part of the report provides insights into the order values that new customers spend when they first interact with your store. Similar to the general AOV distribution, the data excludes extreme values and is divided into deciles. Analyzing this distribution helps you understand initial customer engagement levels and how first impressions might influence spending. These insights are particularly valuable for tailoring initial customer experiences, such as through personalized offers or strategic discounts, to enhance customer retention and boost initial spending.
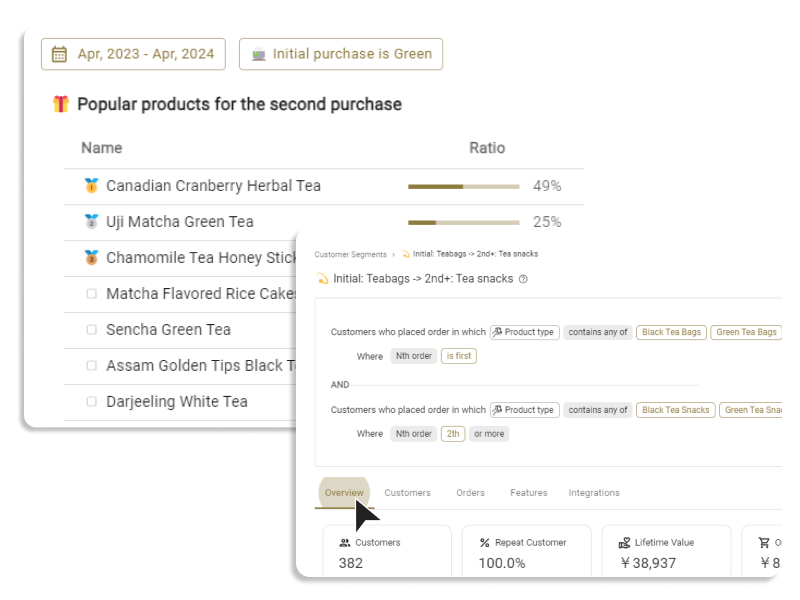
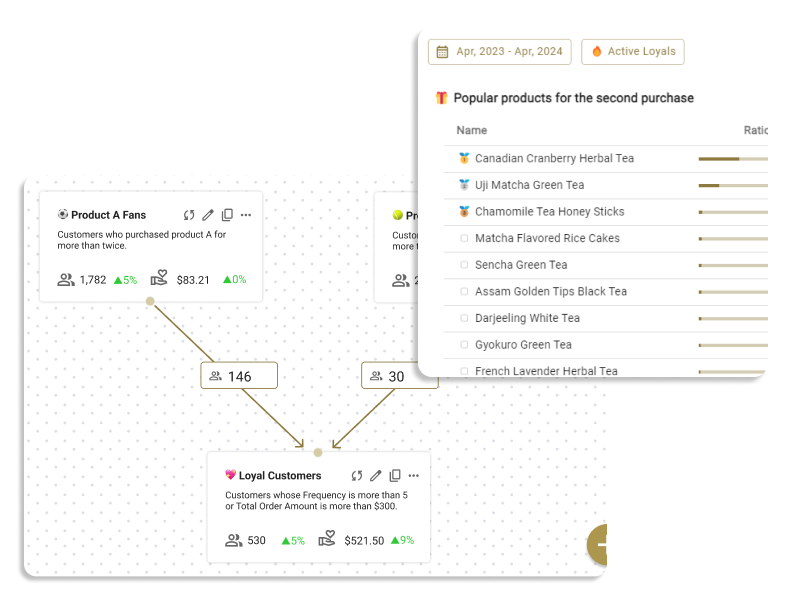
🧮 Popular AOV ranges for the second purchase
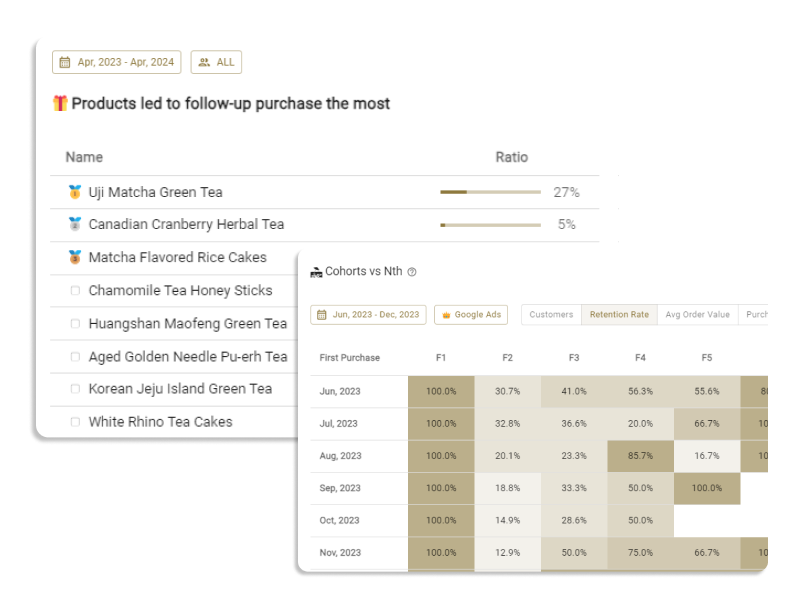
The second purchase is a critical moment in building customer loyalty, and this report section highlights the spending behavior during this phase. By examining how AOVs shift from the first to the second purchase, you can identify trends or significant changes in customer spending habits. This analysis not only reveals how successful your store is at retaining customers but also indicates the effectiveness of follow-up marketing campaigns and the potential of upselling strategies. Insights gained here are crucial for tweaking your engagement tactics to encourage a stronger second-time buyer experience.
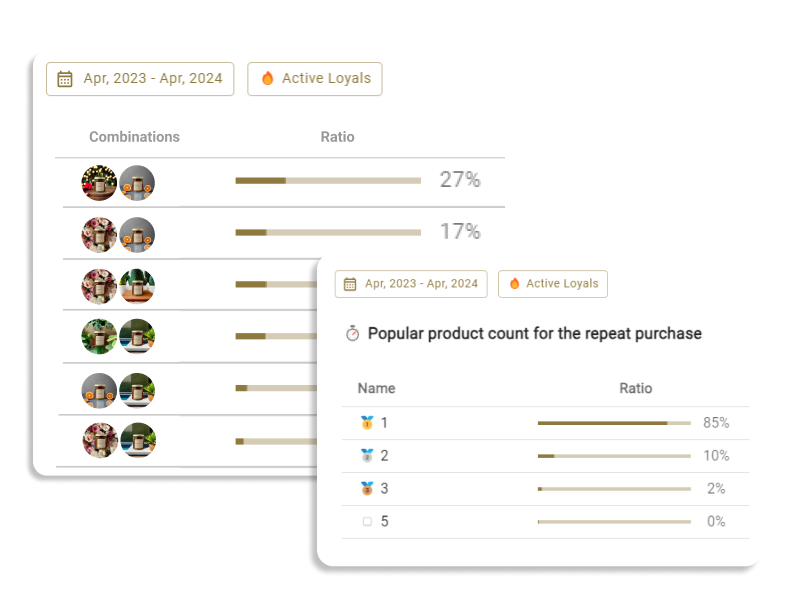
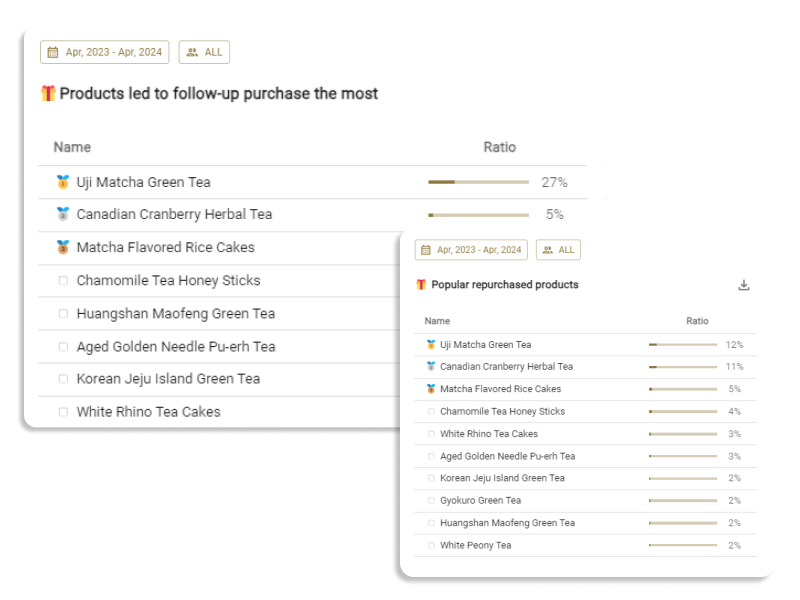
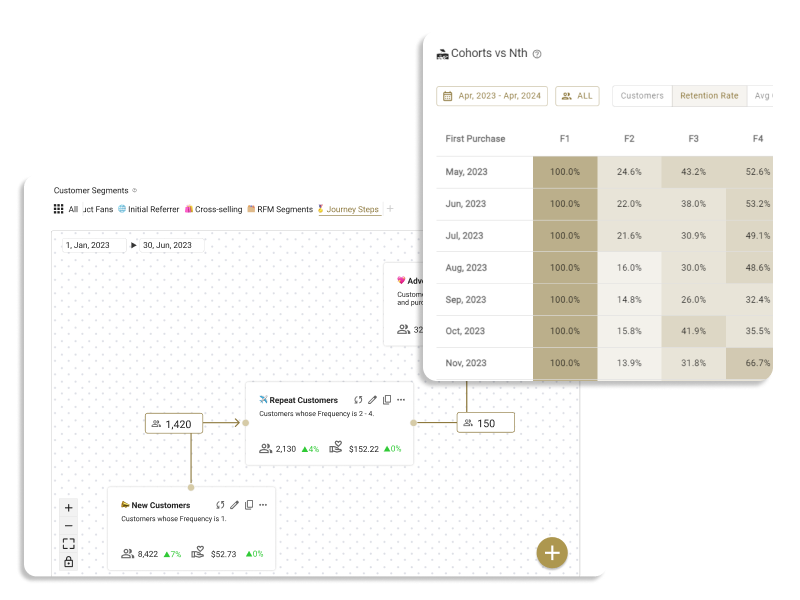
🧮 Popular AOV ranges for the Repeat Purchases
This part of the report examines the AOV distribution among customers making repeat purchases, focusing on the second and subsequent transactions. It follows the same methodological approach as the previous sections—excluding outliers and dividing the data into deciles—to reveal how established customers continue to engage with your store. This segment is essential for understanding the long-term value of repeat customers and is a cornerstone for formulating strategies aimed at maintaining or enhancing customer loyalty. Insights from this analysis help in developing targeted retention strategies, personalized offers, and loyalty programs that resonate with the customer's purchasing behavior.
Why 'AOV distributions' Insights Matter
Understanding the Average Order Value (AOV) through simple averages provides a snapshot, but it doesn't capture the full spectrum of customer spending behaviors. This is where AOV distributions come into play, offering a deeper, more granular view that is crucial for several reasons:
- Strategic Pricing Decisions: AOV distributions allow Shopify store owners to see not just what the average spend is, but how spending is spread across different customer segments. This insight is vital for making informed decisions about pricing strategies, sales promotions, and product bundling. For instance, if a significant portion of customers falls into higher AOV brackets, it may be feasible to introduce premium product bundles or upsell higher-priced items.
- Tailored Marketing Approaches: By understanding which AOV ranges are most common among your customers, you can tailor your marketing efforts to match these spending habits. Campaigns can be customized to target specific segments, encouraging them to move to higher spending brackets. For example, customers in the lower AOV segments might receive promotions that encourage adding more items to their carts, while those in higher segments could be targeted with exclusives and limited editions.
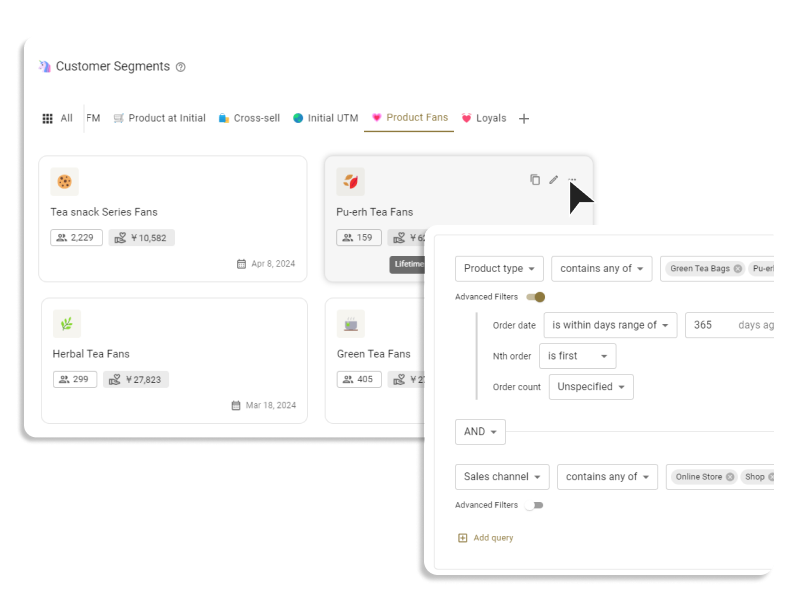
Use Cases - Recommended Segments Filters
- Targeted Segment for Free Shipping Thresholds: Use AOV distribution insights to set effective free shipping thresholds. By understanding the median AOV, ensure your free shipping offer is enticing but not overly generous, optimizing both customer satisfaction and profitability.
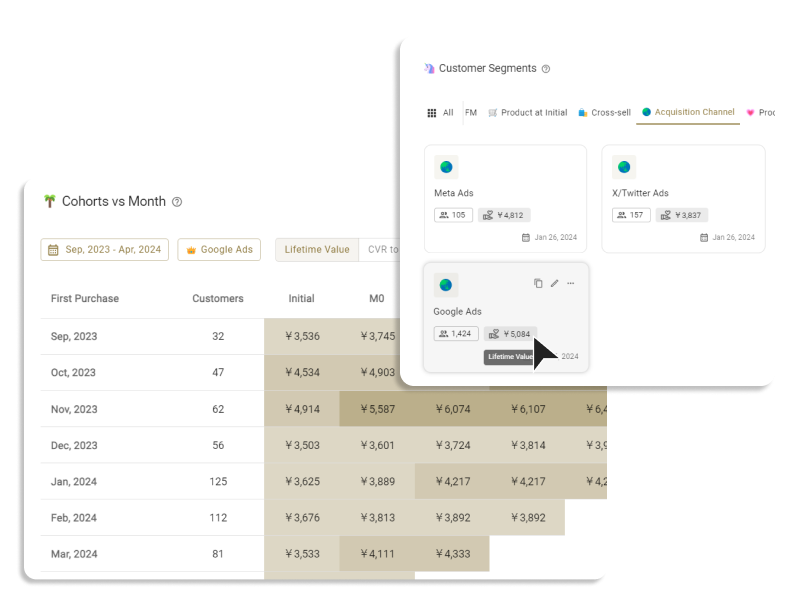
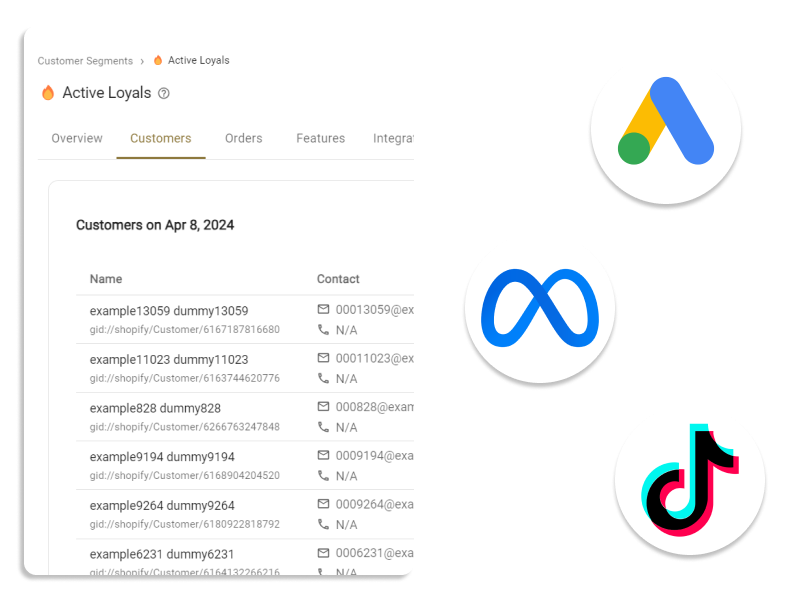
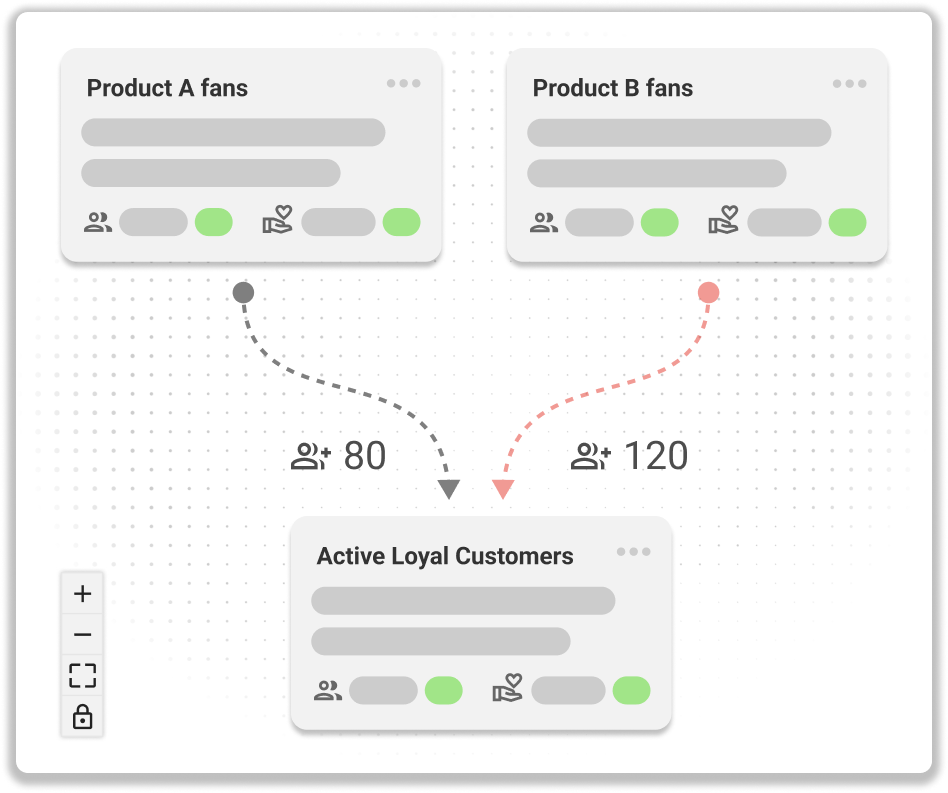
- Repeat or Loyal Customer Segments: Analyze the AOV levels that newly acquired customers reach over time. Understanding their spending patterns from the initial purchase through subsequent purchases can guide your cross-selling and upselling strategies at optimal times.
The 'AOV Distributions' report is a powerful tool for Shopify store owners looking to enhance their understanding of customer spending behaviors. By focusing on distribution rather than just average values, you gain deeper insights into how customers interact with your store, which can be used to refine marketing strategies and ultimately increase both AOV and overall store profitability. Harness these insights to create a more compelling shopping experience that encourages higher spending per transaction.