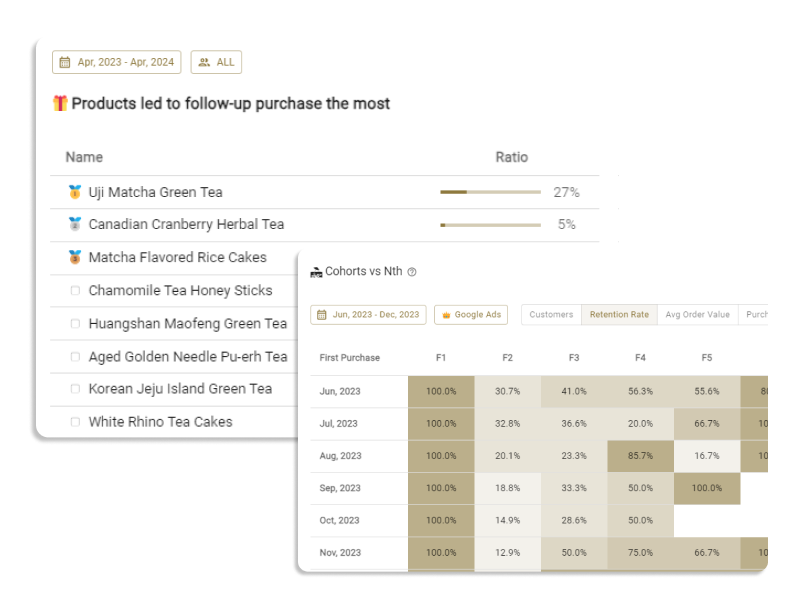
Cohort analysis is a method of gaining practical insights from past order data by dividing customers into groups called "cohorts" and measuring the behavior of each cohort over time.
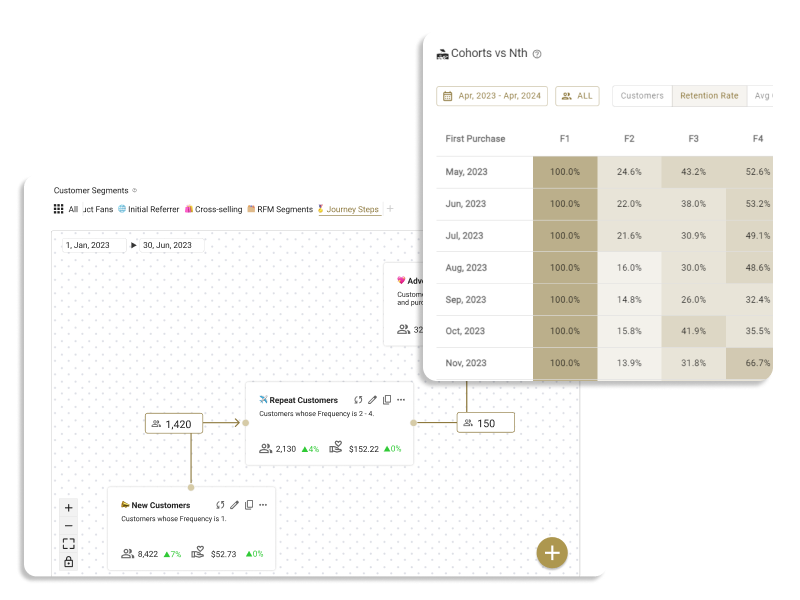
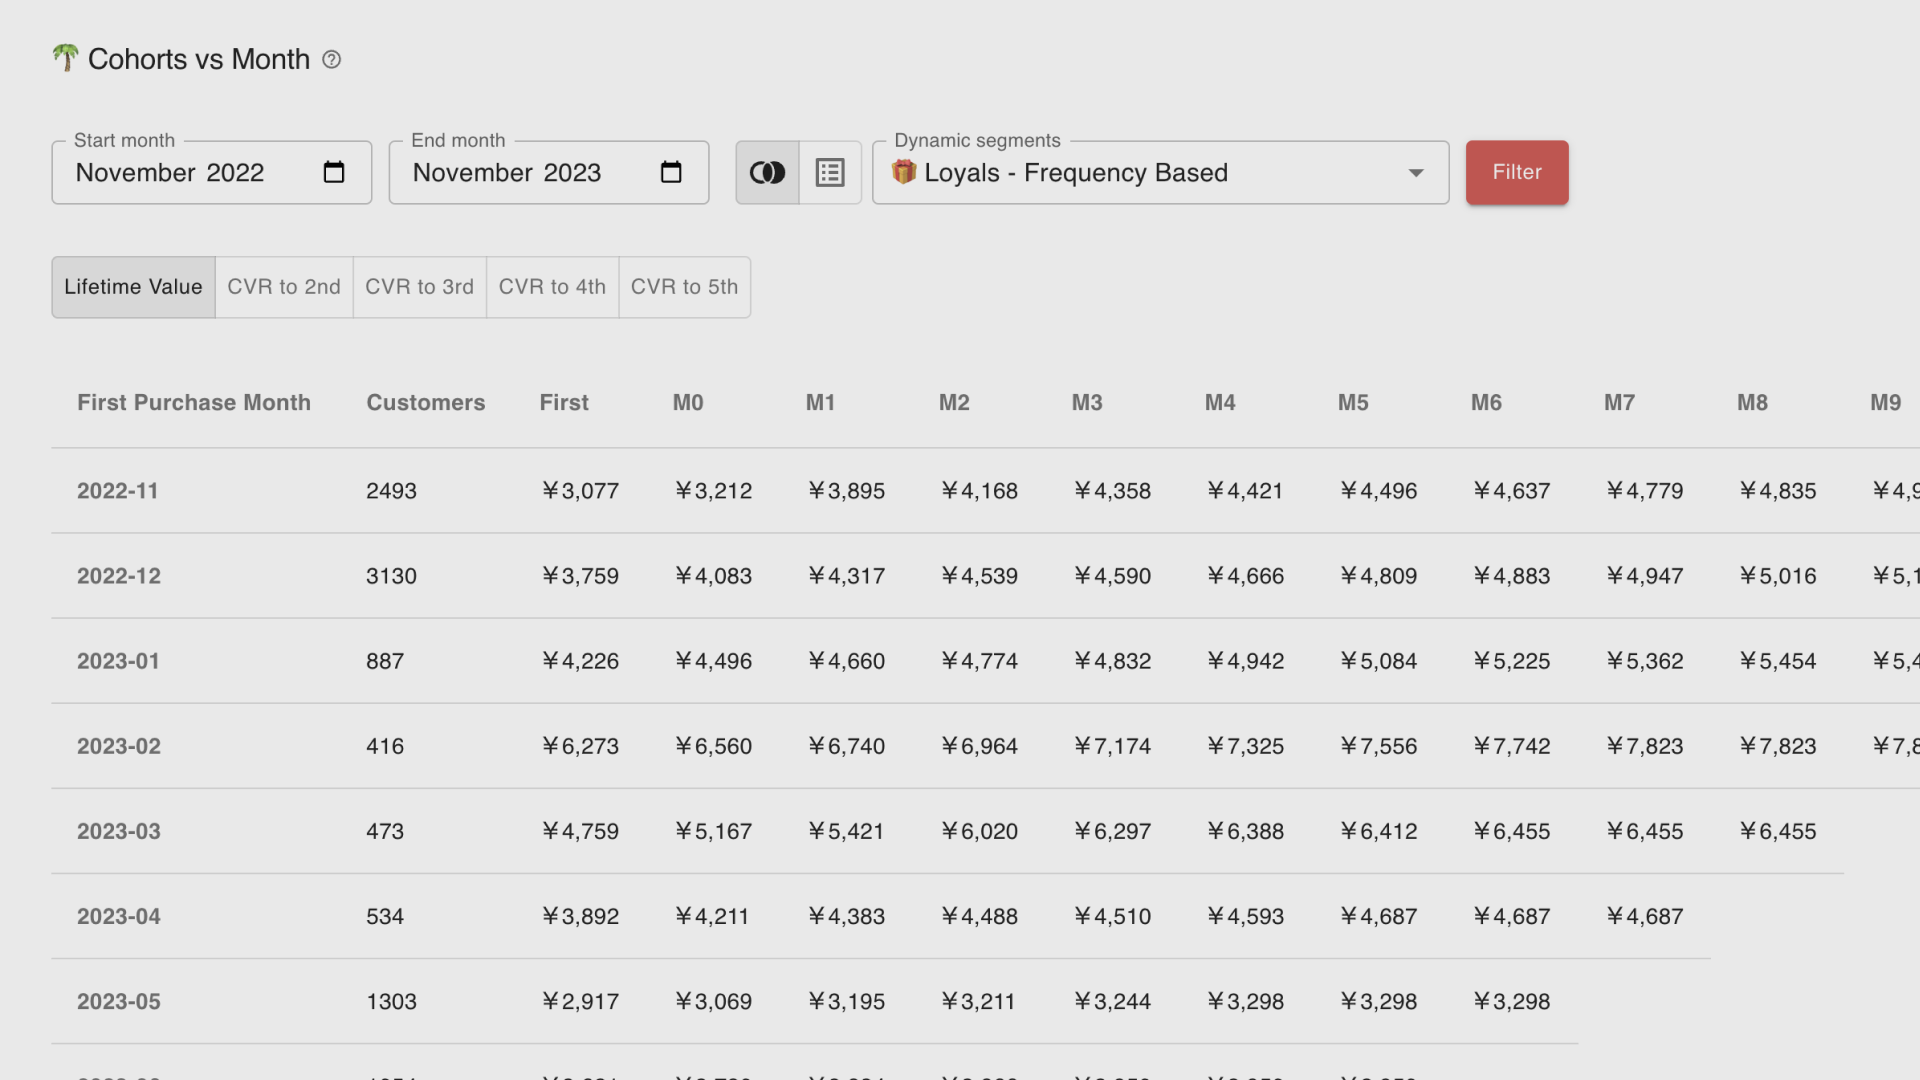
With 'cohorts by first month of purchase' vs 'Nth of purchase (Shown as F1, F2, ..., Fn)', you can see the number of customer and 'Average Order Value' at Fn. 'Retention rate' and 'Purchase interval' are calculated from Fn-1 to Fn,
Available KPIs for Cohorts vs Nth
Metric
Definition
Customers
Number of Customers at Fn or more. For example, “Customers = 100 at F2” refers that 100 customers in the cohort placed more than two orders.
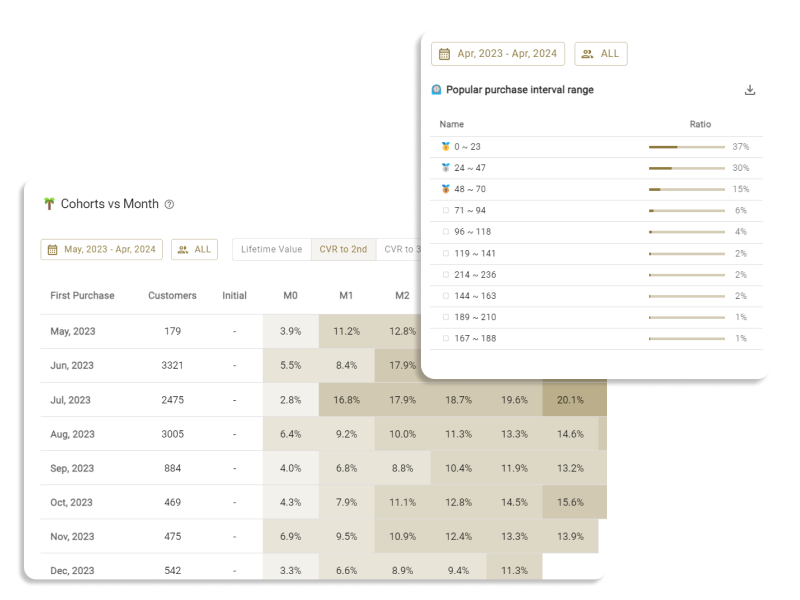
Avg Order Value
Average order value at Fn purchase. For example “Avg Order Value = $100 at F3” refers that customers in the cohort spent $100 on average at their 3rd purchase.
Retention Rate
Retention rate from Fn-1 to Fn.
Purchase Interval
Average days between purchases from Fn-1 to Fn.
Table Definition
Metric
Definition
First Purchase Month
For example, for "2021-12", this refers to "Customers who made their first purchase in December 2021”
Fn
Nth of purchase (Shown as F1, F2, ..., Fn) of each customer.
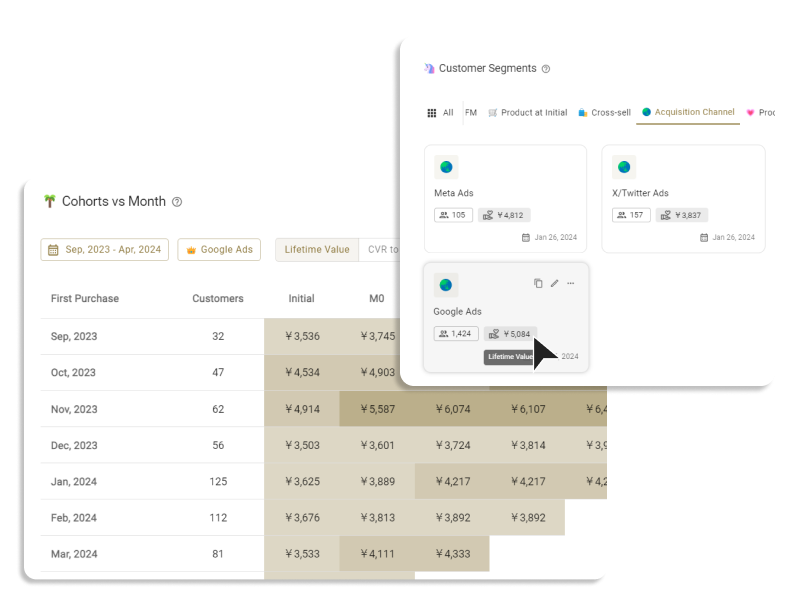
Over all time
The result of aggregating the selected entire period
Function
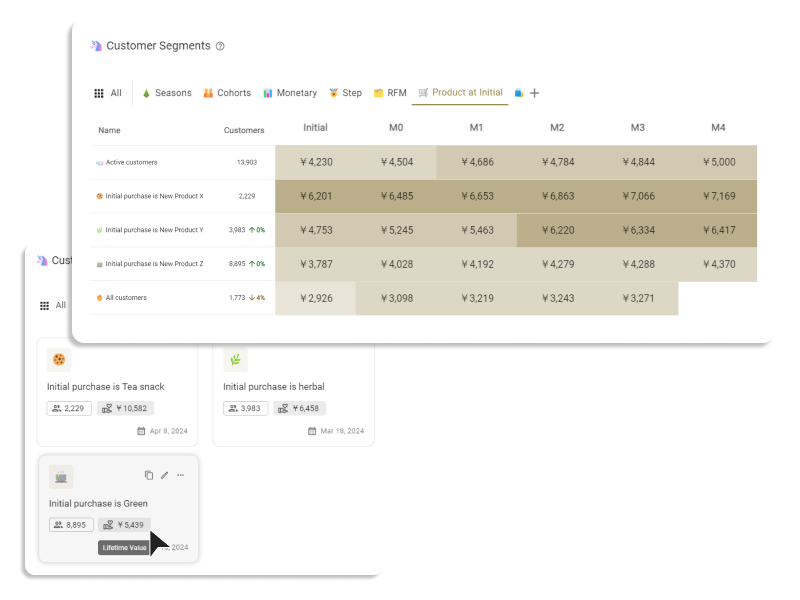
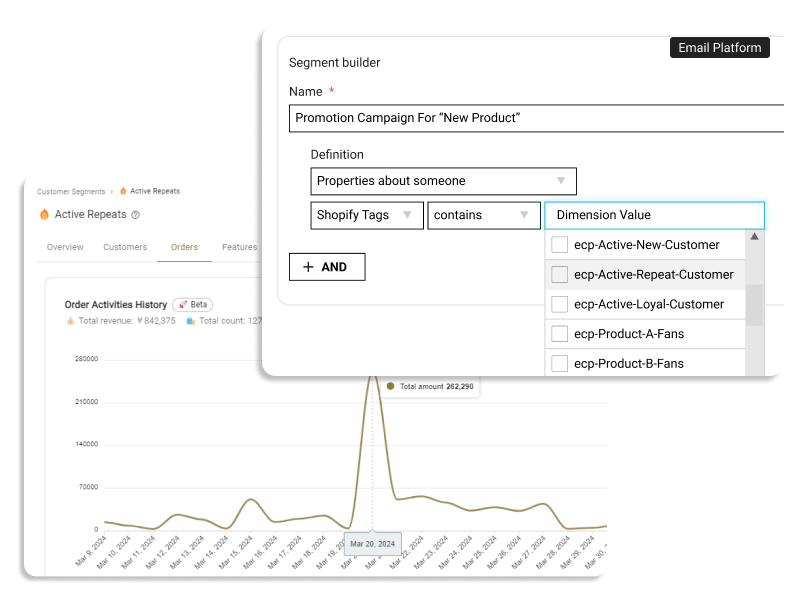
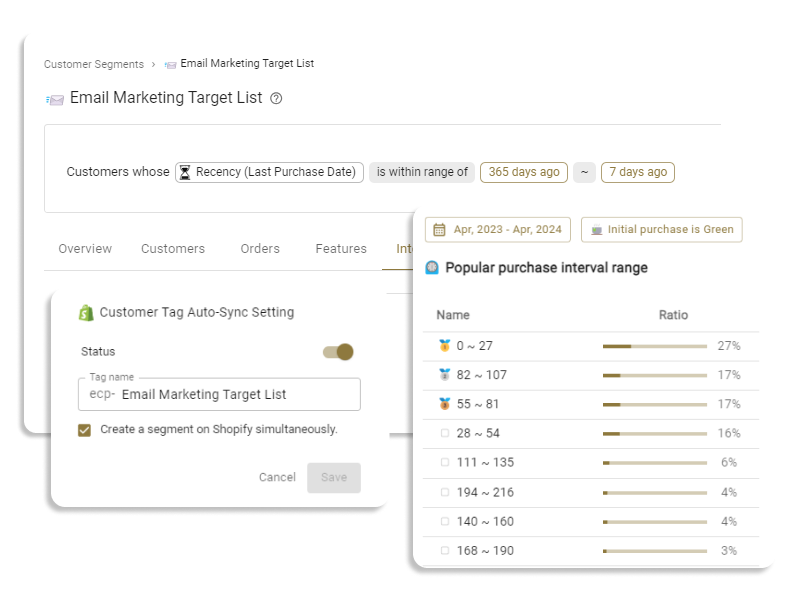
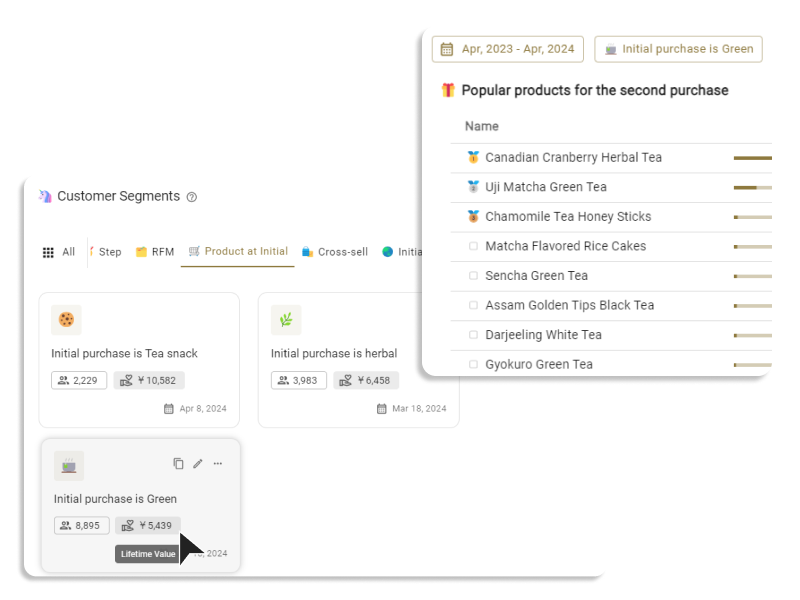
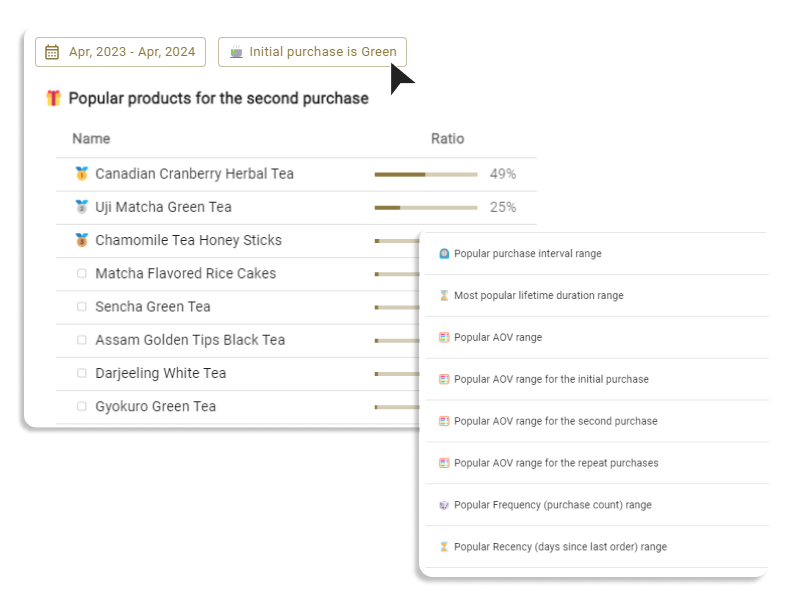
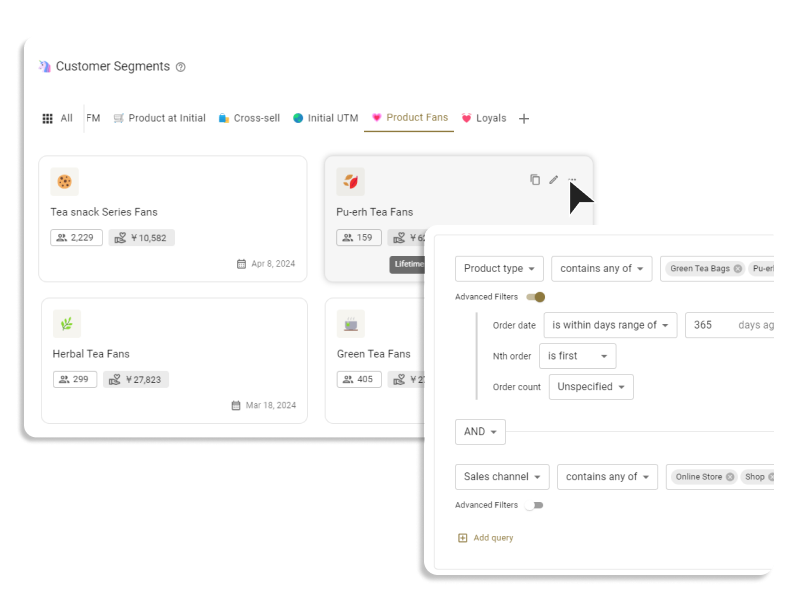
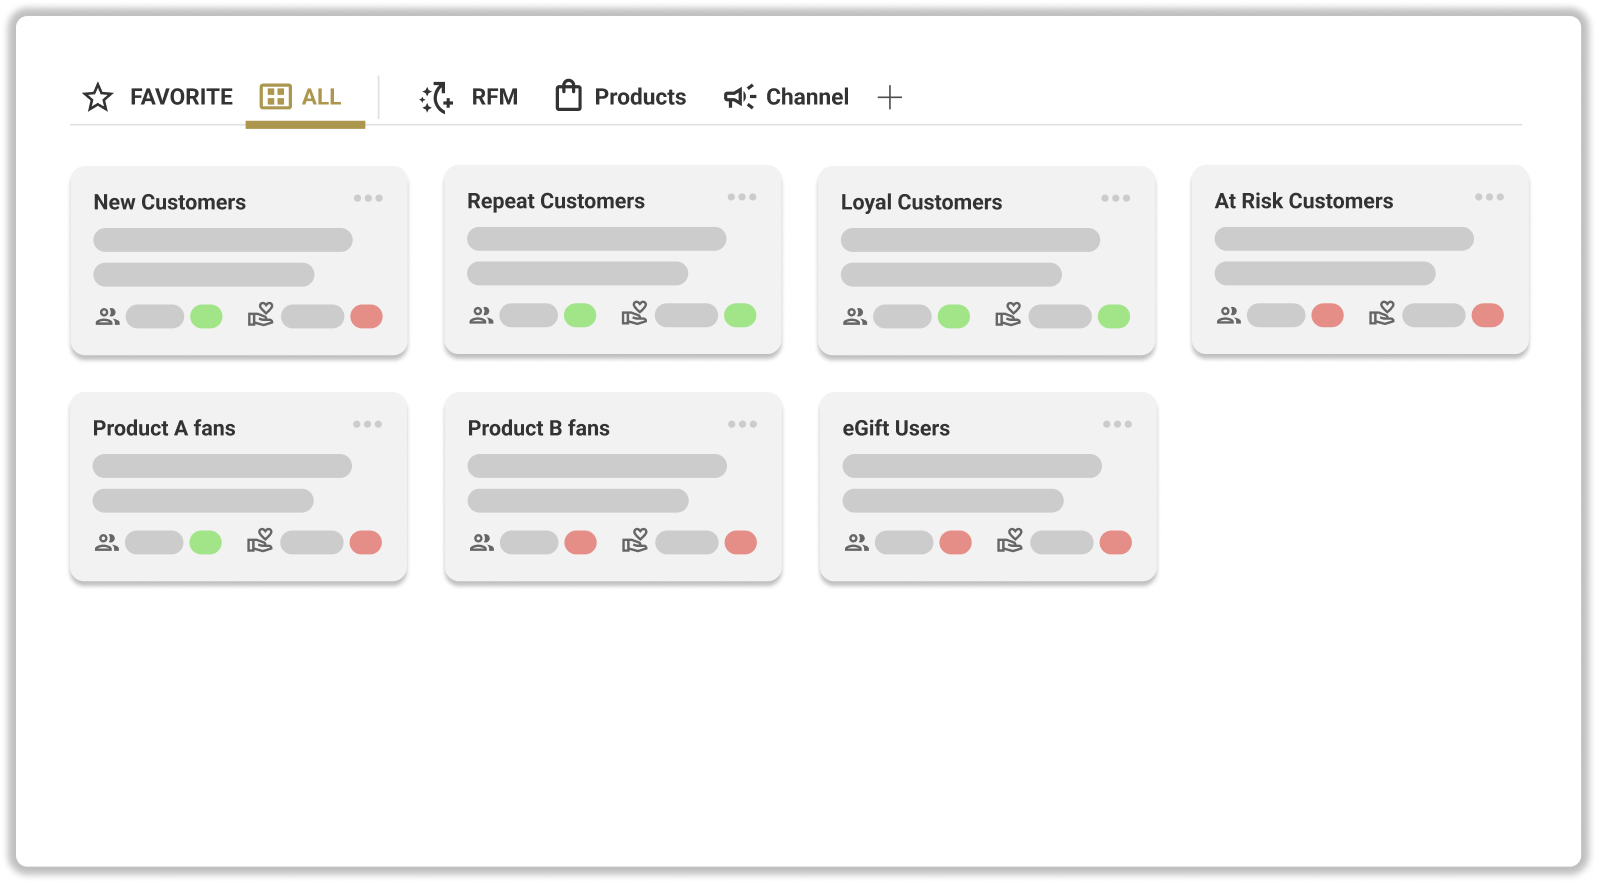
Filter by segment
You can select the customer segment to filter the result.
Edited and supervised by Product Manager of ECPower - Shopify Customer Segment & Journey Management, supporting Shopify merchants' CLV growth, CRM strategy and data analytics.
.png)