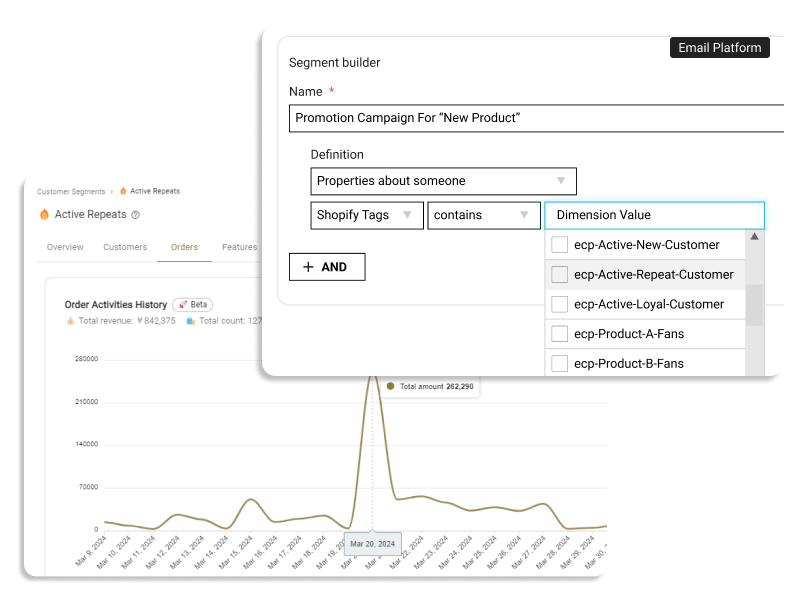
In the dynamic world of e-commerce, timing can be everything. Knowing when customers are most likely to make their initial and repeat purchases can help you tailor your marketing strategies and inventory management to meet demand efficiently. The 'Popular Order Year-Month' report from your Shopify analytics provides a granular look at when specific segments of your customer base are most active, helping you to identify and capitalize on peak seasons.
Detailed Insights from the "Order Year-Month" Report
This report breaks down the buying patterns of your customers according to the year and month, offering insights into the seasonal trends that can inform your business strategies.
🗓️ Popular Year-month
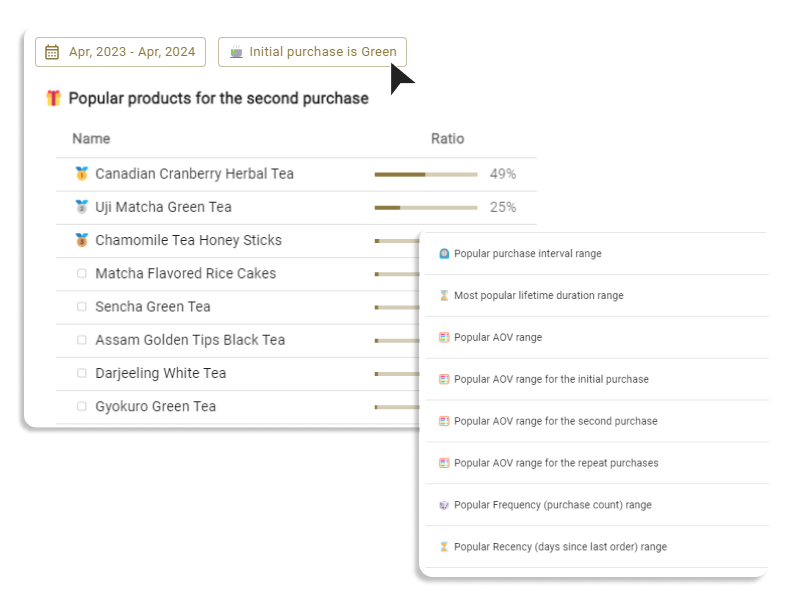
This section of the report highlights the most active months for order placement within each customer segment. Data is sorted in descending order, showcasing the months with the highest customer activity along with the ratio of customers compared to the total member count in that segment.
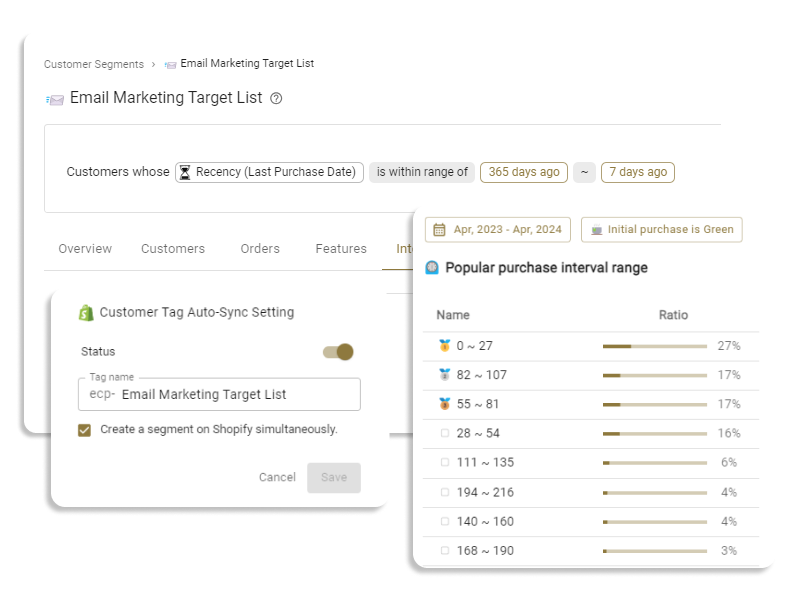
🗓️ Popular Year-month for the Initial Purchase
Identifying the most popular months for initial purchases is crucial for understanding when new customers are most likely to start their journey with your store. This data provides valuable insights into when your store successfully attracts new buyers, which can be pivotal for planning introductory marketing campaigns.
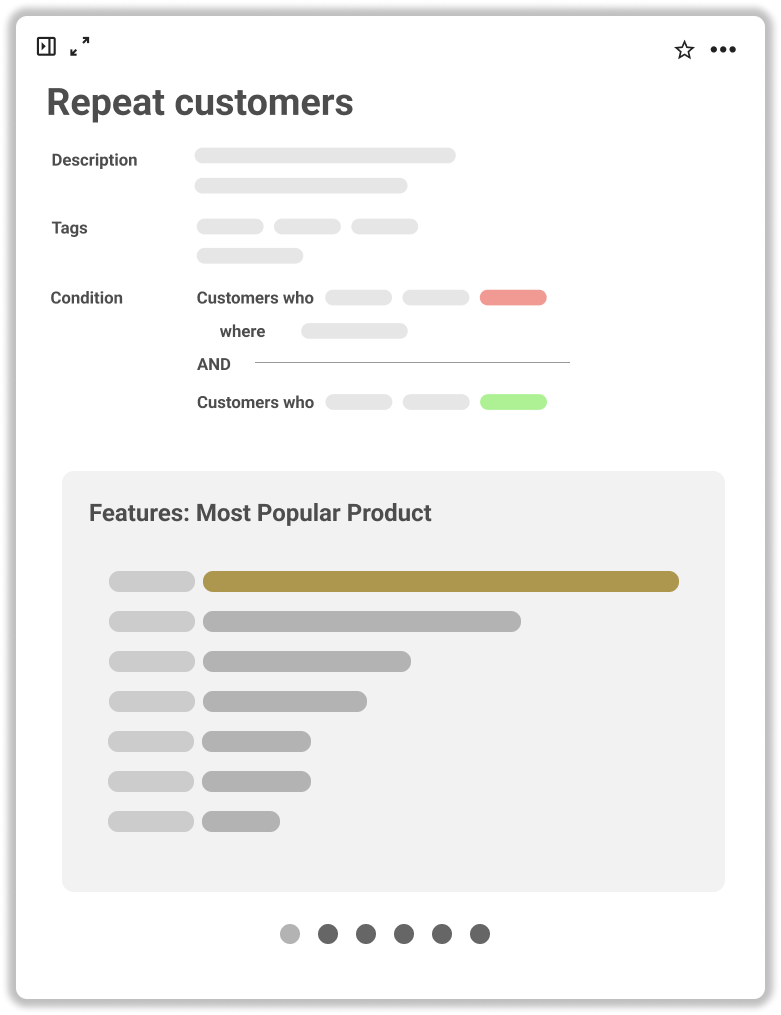
🗓️ Popular Year-month for the Repeat Purchases
For businesses focused on customer retention, knowing when existing customers come back is just as important as knowing when they first arrive. This part of the report details the months when repeat purchases peak, sorted by the customers count relative to the number of repeat customers in the segment. This information is vital for scheduling engagement and retention strategies.
Why 'Popular Year-month' Insights Matter
Seasonal trends in purchasing behavior can vary significantly across different customer segments and can be influenced by several factors, including regional holidays, special events like Black Friday Cyber Monday (BFCM), and even weather patterns. Understanding these patterns allows you to:
- Optimize Inventory: Stock up or scale down your inventory based on anticipated demand.
- Tailor Promotions: Schedule sales, discounts, and special offers when they are most likely to influence buying decisions.
- Customize Marketing Messages: Adapt your messaging to resonate with the seasonal interests and needs of your customers.
Use Cases - Recommended Segments Filters
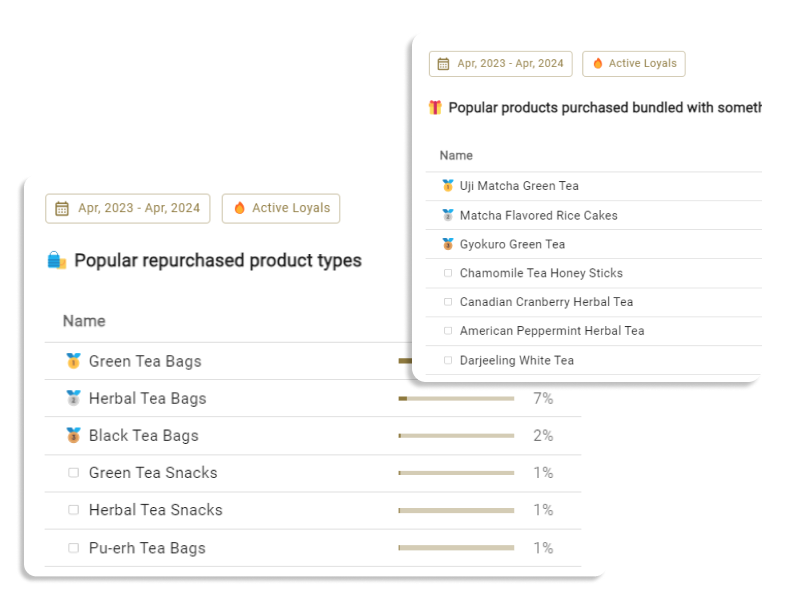
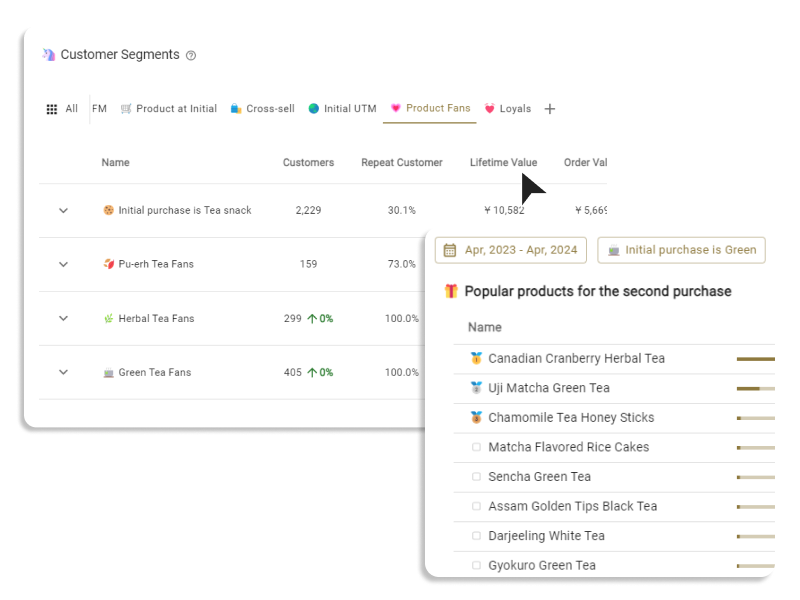
- Repeat or Loyal Customer Segments: Analyze when your most loyal customers initially purchased and when they tend to make repeat purchases. Use this data to refine the timing of your loyalty programs and retention campaigns, ensuring they are active during your customers’ peak engagement periods.
- Segments Based on Locations: Different locations may show different seasonal peaks due to local events, holidays, or even climate conditions. Segmenting your data by location can help you customize your marketing efforts to match local buying patterns, enhancing the effectiveness of your targeted campaigns.
By utilizing the 'Popular Order Year-Month' insights, you can strategically plan your marketing and inventory efforts to align perfectly with the times your customers are most engaged. This approach not only enhances customer satisfaction and retention but also optimizes your resource allocation, ultimately contributing to a more robust bottom line.