Introduction
In the growth of eCommerce, CLV (Customer Lifetime Value) is an extremely important KPI. However, there are practical challenges with the general calculation method. Cohort-based CLV analysis is a practical and effective method to address these operational challenges. This article is aimed at eCommerce marketing professionals who are working on improving CLV, and it explains the concept of cohort CLV analysis and provides concrete examples.
What exactly is CLV?
CLV (Life Time Value) is translated as "customer lifetime value" and is also referred to as CLV (Customer Lifetime Value). It represents the average total profit a customer brings to a company over their lifetime. CLV can measure the value each customer represents to a brand.
This metric is more appropriately viewed as a business management indicator rather than a marketing KPI. It can be utilized across different departments. For example, it can serve as a metric for adjusting advertising investments, focusing on increasing repeat purchases, optimizing the cost rate of products, etc.
This article is written for those who already understand the concept of CLV. For a basic explanation of CLV, please refer to the article linked below.
Reference Article:
The challenges of measuring CLV in eCommerce
General CLV Calculation Method
For instance, the approach advocated in the blog of Shopify, which operates an eCommerce platform, is a good example of the general CLV calculation method. Shopify suggests the following definition-based method to estimate CLV:
CLV=Average Order Amount * Purchase Frequency * Average Lifespan
Where:
- Average Order Amount: The average order amount for a typical customer
- Purchase Frequency: The average order frequency of a typical customer
- Average Lifespan: The average duration a customer continues to order
Reference Article: (Link not provided here)
For example, if the average order amount is 50 USD, a customer orders from the store twice a year, and continues purchasing for an average of 5 years, then:
CLV=50 USD * 2 * 5=500 USD
While this calculation is straightforward and easy to understand, when applied to actual eCommerce stores, questions arise. For instance, how should one predict the lifespan of a customer?
Challenges of the General CLV Calculation Method
In conclusion, it's almost impossible to measure CLV according to its strict definition. This is because, according to the definition of CLV, one needs to predict the exact date and amount of all future orders.
Of course, academically, various approaches have been proposed that claim to estimate future transactions and customer lifespan, thereby deriving an accurate CLV estimate. However, the reality is that, as of now, there isn't a method that is considered reliable.
When summarizing the reasons these approaches are deemed insufficient, they fall short in terms of "practicality" and "reliability."
Challenges from a Reliability Perspective
As mentioned earlier, the method published by Shopify depends on accurately predicting customer lifespan to ensure the precision of the CLV figure. For typical eCommerce stores, this is challenging.
In the case of eCommerce businesses, it's tough to determine when a customer's "lifetime" has ended. For instance, a customer who has been inactive for several months might return due to an email campaign. Conversely, a customer who made multiple purchases in a month might not buy anything in the subsequent months. These are scenarios that those in charge of eCommerce marketing might frequently encounter.
Shopify suggests using three years as the average lifespan if it's unknown. However, this figure does not take into account differences between products or industries. If the actual average lifespan was 1.5 years, following the definition, the real CLV would be halved. It could be argued that relying on such uncertain predictions for business KPIs is irrational and impractical.
Challenges from a Practicality Perspective
Let's assume, for the sake of argument, that you could accurately calculate a reliable CLV. Would that CLV be a number that can be effectively utilized for business decision-making or marketing activities?
Business Decision-making
For instance, consider whether it would be useful for predicting future cash flow or determining Customer Acquisition Cost (CAC).
If the average CLV was calculated to be 1,000 USD, you wouldn't know when or how that 1,000 USD would materialize as cash flow. For instance, you couldn't distinguish between the following two scenarios:
- Most of the CLV is provided by the initial order, with subsequent contributions being minimal.
- Customers tend to order more expensive products gradually over a long period after initially purchasing discounted goods.
Without understanding how "customer value" is distributed over a lifetime, it's impossible to estimate future cash flows or when Customer Acquisition Cost (CAC) might fail.
Marketing Activities
Let's say, for example, in an eCommerce store for baby and kids' products, the average CLV is calculated to be 1,000 USD. However, in this store, there are two main customer segments: those who primarily purchase toys worth 2 - 300 USD and those who focus on buying consumables like diapers that cost around 10 USD.
These customer segments differ in terms of average order amount and purchase frequency. The same applies to customer lifespan. While toys might be purchased continuously until the child reaches a certain age, the lifespan of customers buying diapers might only last a few months to a few years at most.
It's only natural to assume that CLV values would differ based on customer needs and purchasing intentions. Therefore, in many cases, the average CLV for the entire eCommerce store is not practically meaningful. Without understanding CLV on a segment-by-segment basis, one cannot translate it into specific marketing measures to improve CLV.
The Correct Way to Think About CLV in eCommerce
The key point is that asking "What is the average CLV of all my customers?" is the wrong question from a marketing operational standpoint.
A better question might be:
"What is the average customer value (3-month CLV) after the first order? How about 6 months, 9 months, 12 months, or 24 months?"
By knowing how the total average CLV is distributed over a timeline, you can predict the return on customer acquisition cost and the monthly cash flow. This information helps in deciding how much to invest in acquiring new customers and how to manage budgets in the future.
"Compared to recent customers, how does the CLV of an average customer from a year ago differ 3 months and 6 months after the first order?"
By comparing the CLV from the first order after N months based on the time of the initial purchase, you can clearly determine based on actual data whether the "CLV is improving." Additionally, you can discover differences in customer behavior over time.
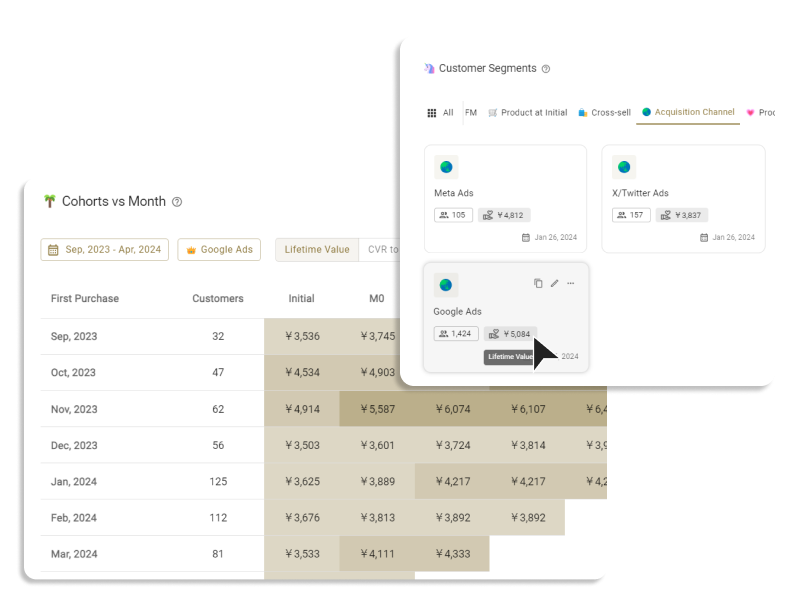
"How does CLV differ between acquisition routes? How about the type of purchased product or attributes such as country or region?"
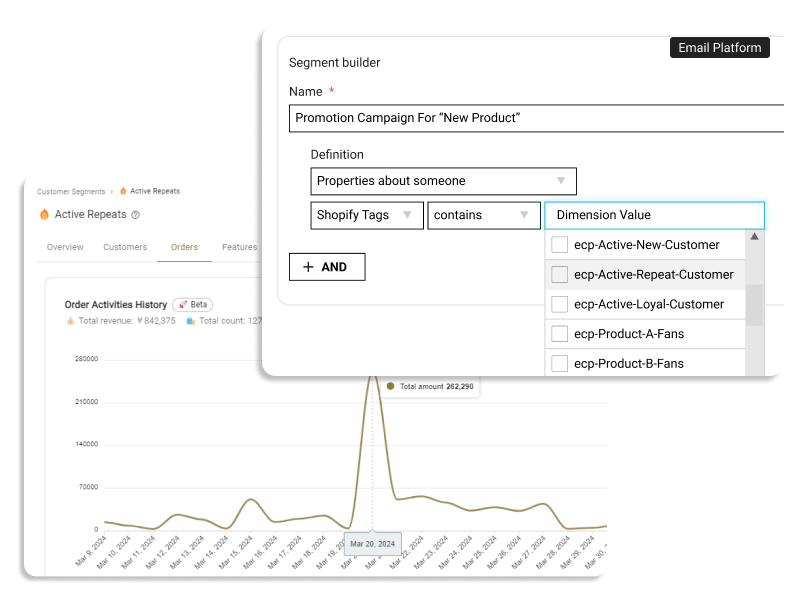
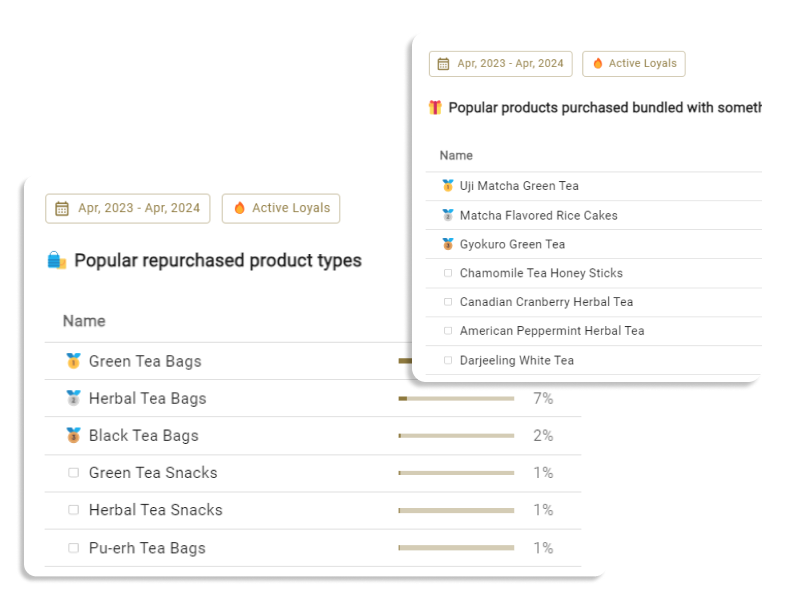
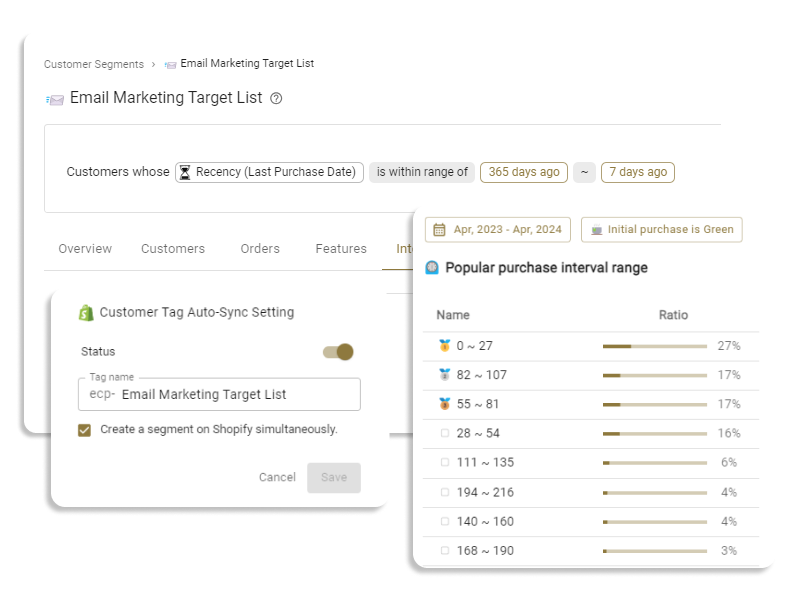
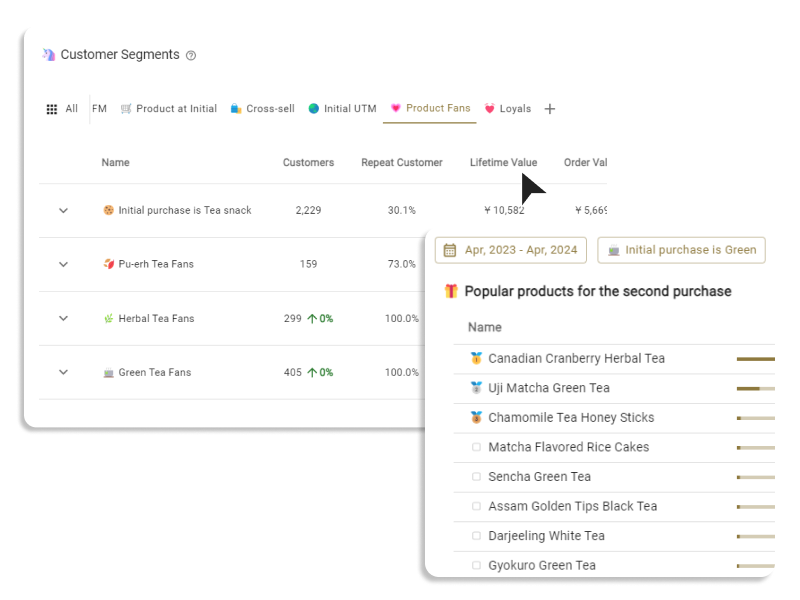
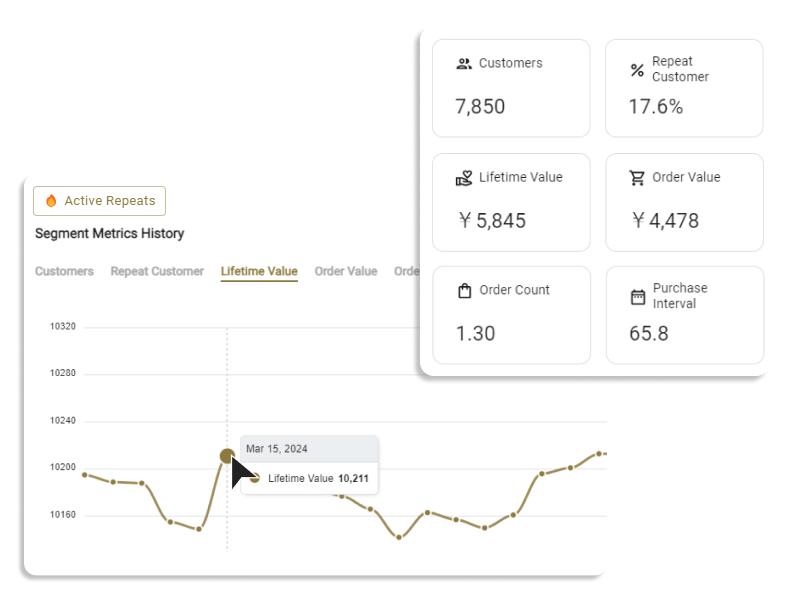
By understanding the CLV for each customer segment, you can determine which segments to focus on to improve the overall CLV. If you know the purchase frequency and average order amount for each segment, you can consider what measures to take based on the characteristics of the segment. In other words, segmentation makes the data more practical.
Calculating CLV with Cohort Analysis
The solution to the challenges pointed out so far is the cohort analysis approach to calculating CLV. From here, we will explain what cohort analysis is, why it excels in reliability and practicality, and how to conduct a refined approach.
What is Cohort Analysis?
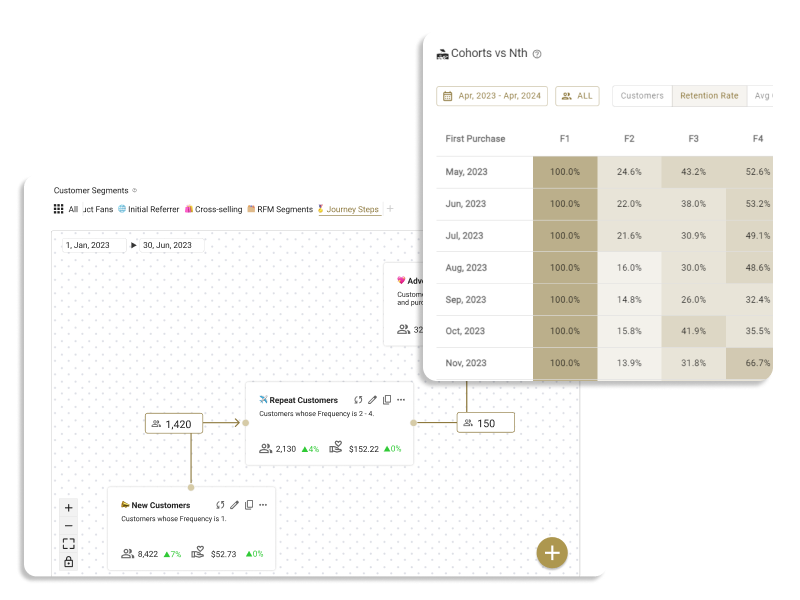
Cohort analysis is a method that divides customers into groups called "cohorts" and measures the behavior of each cohort over time, deriving practical insights from past order data.
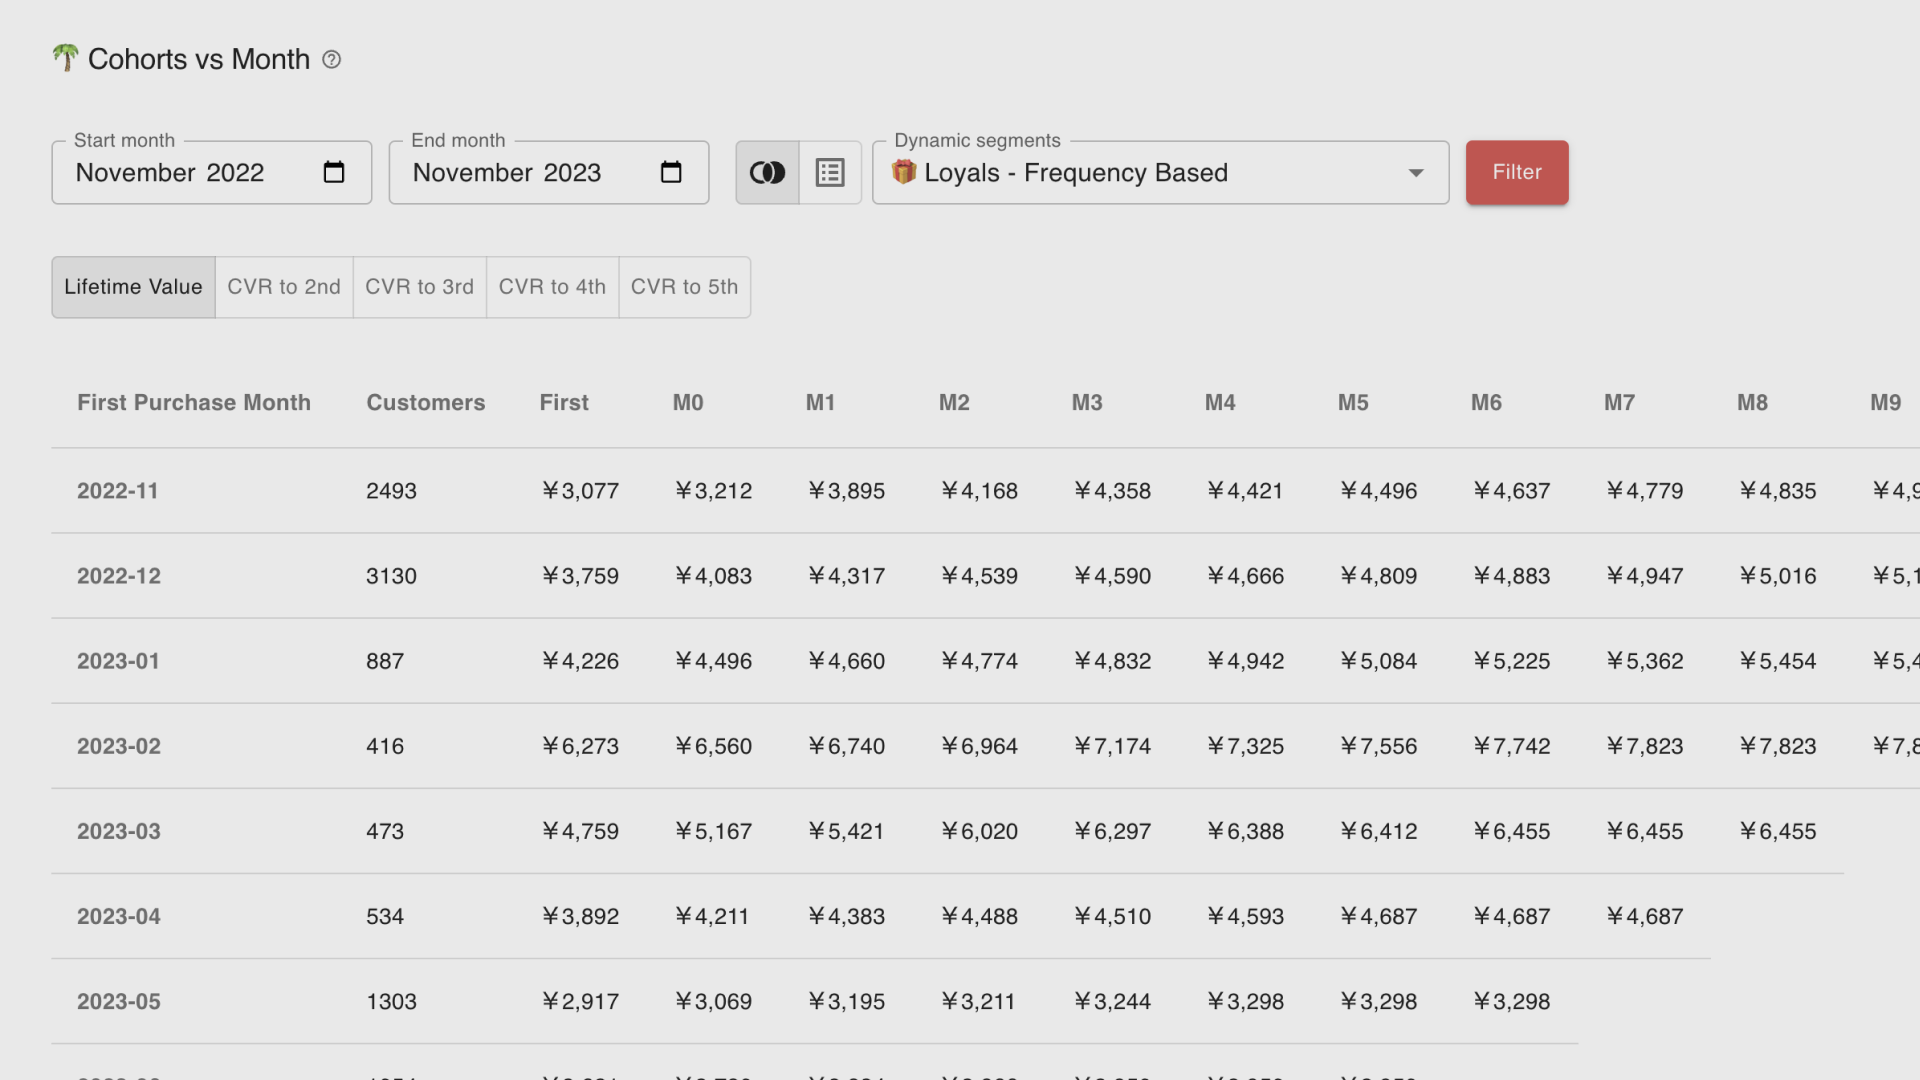
When calculating and analyzing CLV with cohorts, customers are segmented based on the time of their first purchase (in many cases, "month"), and the CLV (total sales per customer) is calculated for 1 month, 2 months, ... , N months.
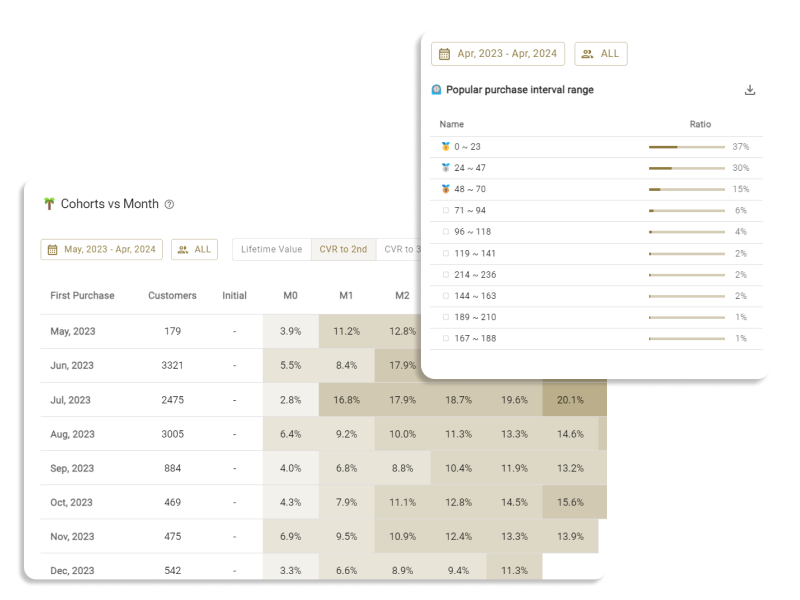
For instance, here is a simple cohort analysis created in Excel based on 6 months of Shopify data from a particular store.
.png)
First, let's focus on the cohort from January 2023. If we look horizontally at the row, the average initial purchase amount was 57 USD. Column 4 shows the average CLV up to one month after the initial purchase (i.e., the 0-month mark). Therefore, it considers all sales, including repurchases within one month, not just the initial purchase.
Similarly, column 5 shows the average value considering all sales from after 1 month up to 2 months.
The last column represents the CLV for the 5th month (CLV up to 6 months). The figure 132 USD is derived by dividing the total sales up to 6 months made by customers in this cohort by the number of customers in the cohort, which is 3,000.
The same calculation process applies to all other cohorts, but as the number of elapsed months from the first order to the present is less, each newer cohort has one less column.
Before delving into a more detailed analysis, let's verify the reliability and practicality of cohort analysis.
Reliability of Cohort Analysis
In cohort analysis, no assumptions are made about the future; it is based only on accurate customer behavior data from the past and present. While making decisions solely based on past customer behavior does have its caveats, it's far more preferable than relying on unreliable metrics that include uncertain future predictions.
Practicality of Cohort Analysis
Now that we can understand how the overall CLV materializes over time, like "2-month CLV" or "3-month CLV", it becomes actionable for actual business decisions.
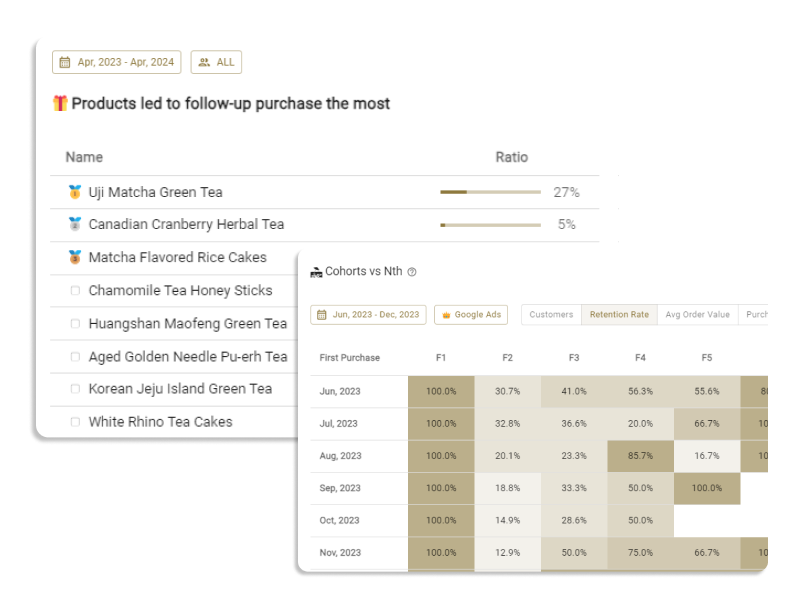
For instance, with cohort CLV analysis, you can pinpoint when most repeat purchases were made (when the N-month CLV jumps up) or when the majority of customers' lifetimes have ended (when the CLV starts to plateau).
Moreover, if you understand the customer acquisition cost for each cohort month, you can determine the time it takes for the customer acquisition cost and CLV to balance. By comparing with cohorts from other months, you can judge if the data for that month is an outlier, or how the CLV growth of current customers compares to past customers, among other trends.
Refining Cohort Analysis Further
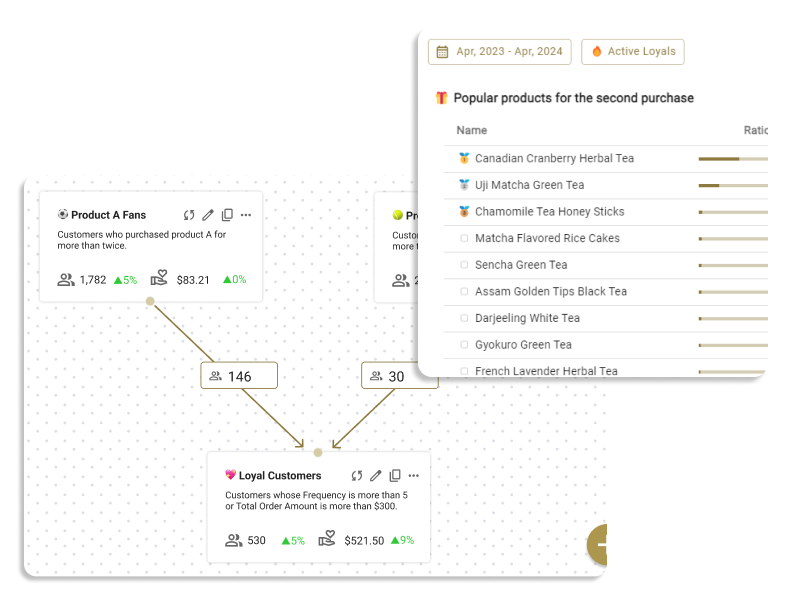
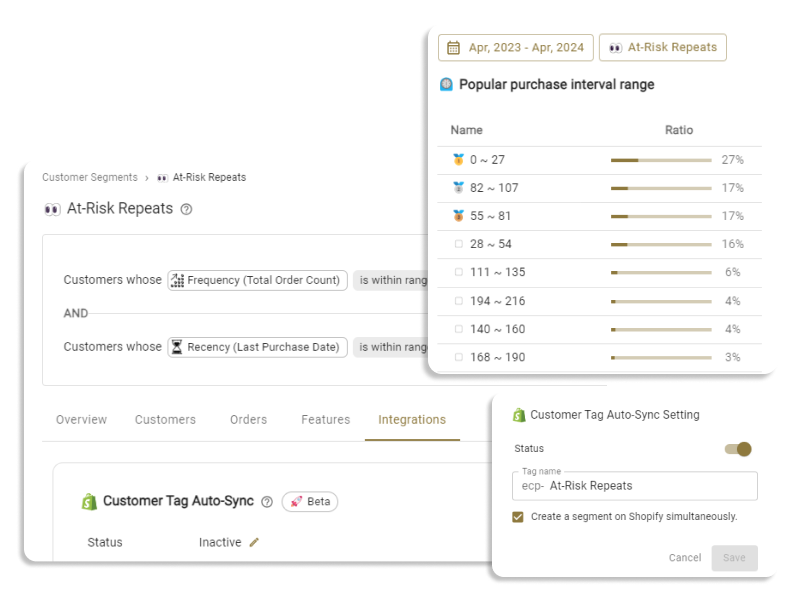
The next challenge is to "identify the most profitable customers and determine how to discern the factors that realize a high customer CLV". Here, customer segmentation becomes crucial.
Cohort Analysis for Customer Segments
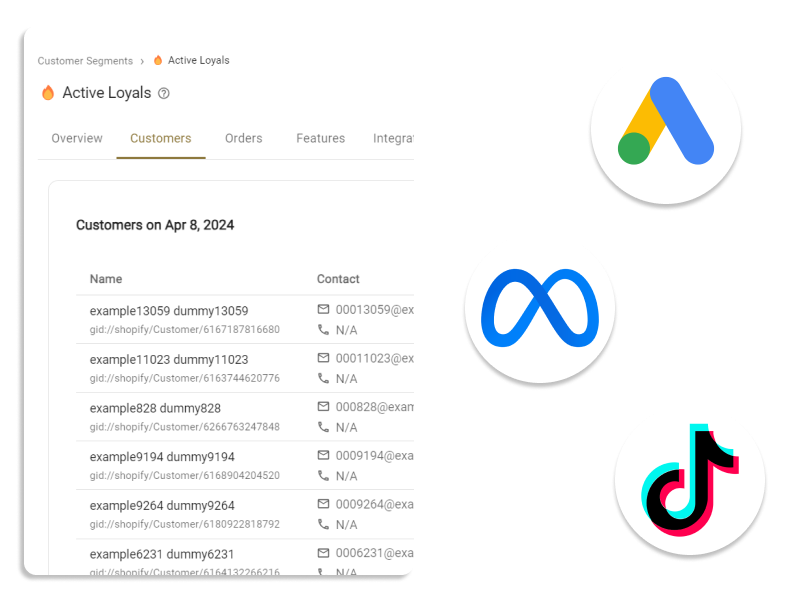
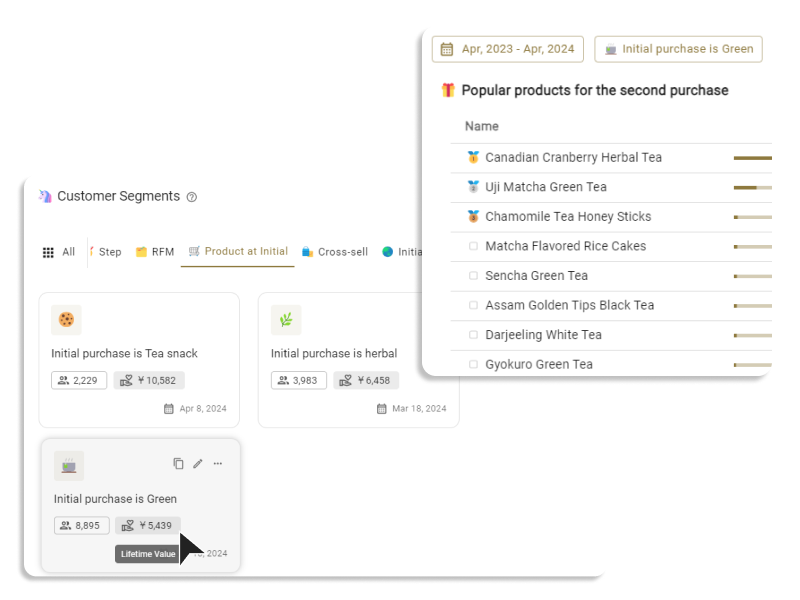
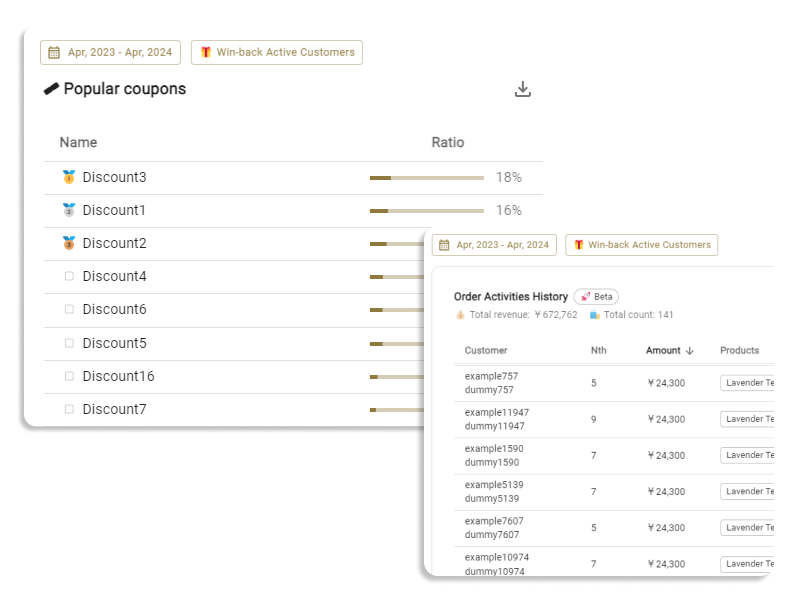
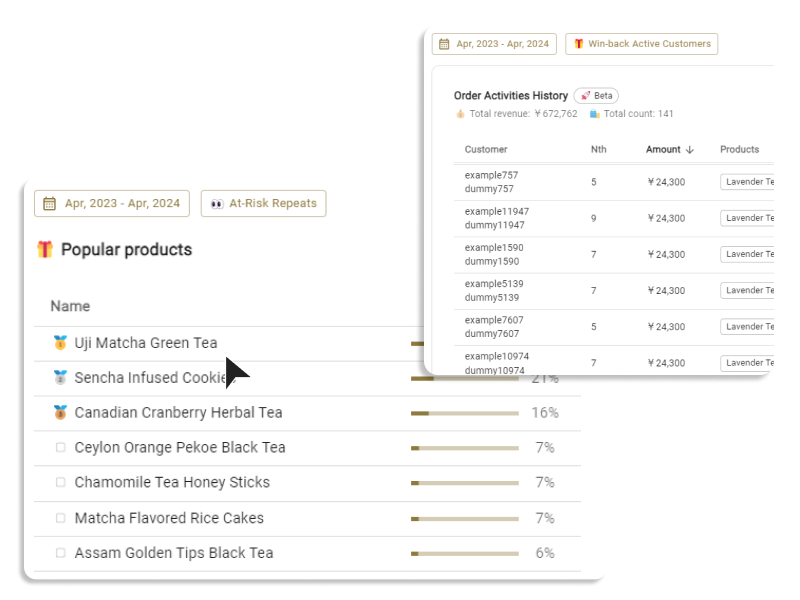
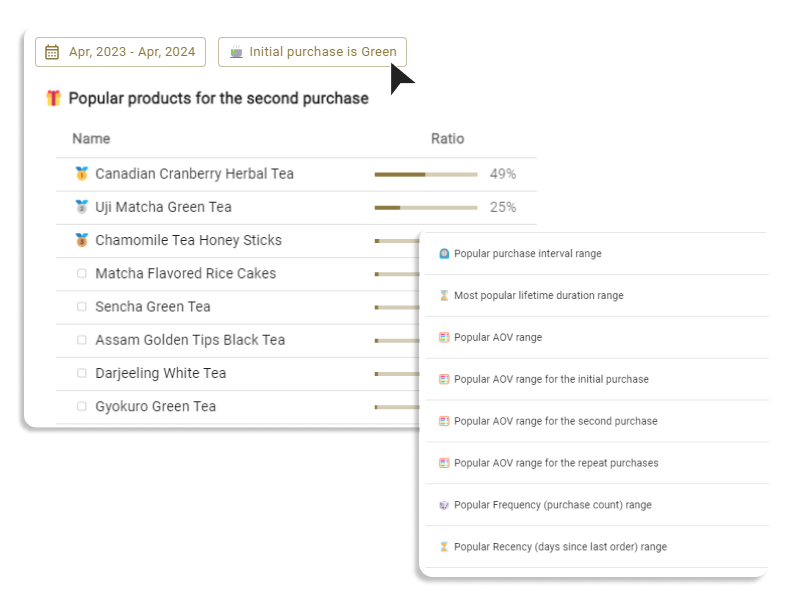
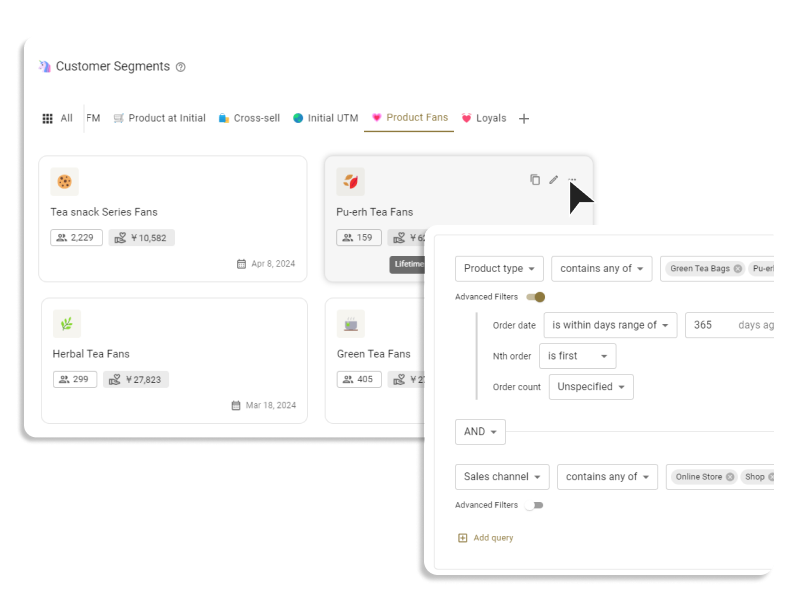
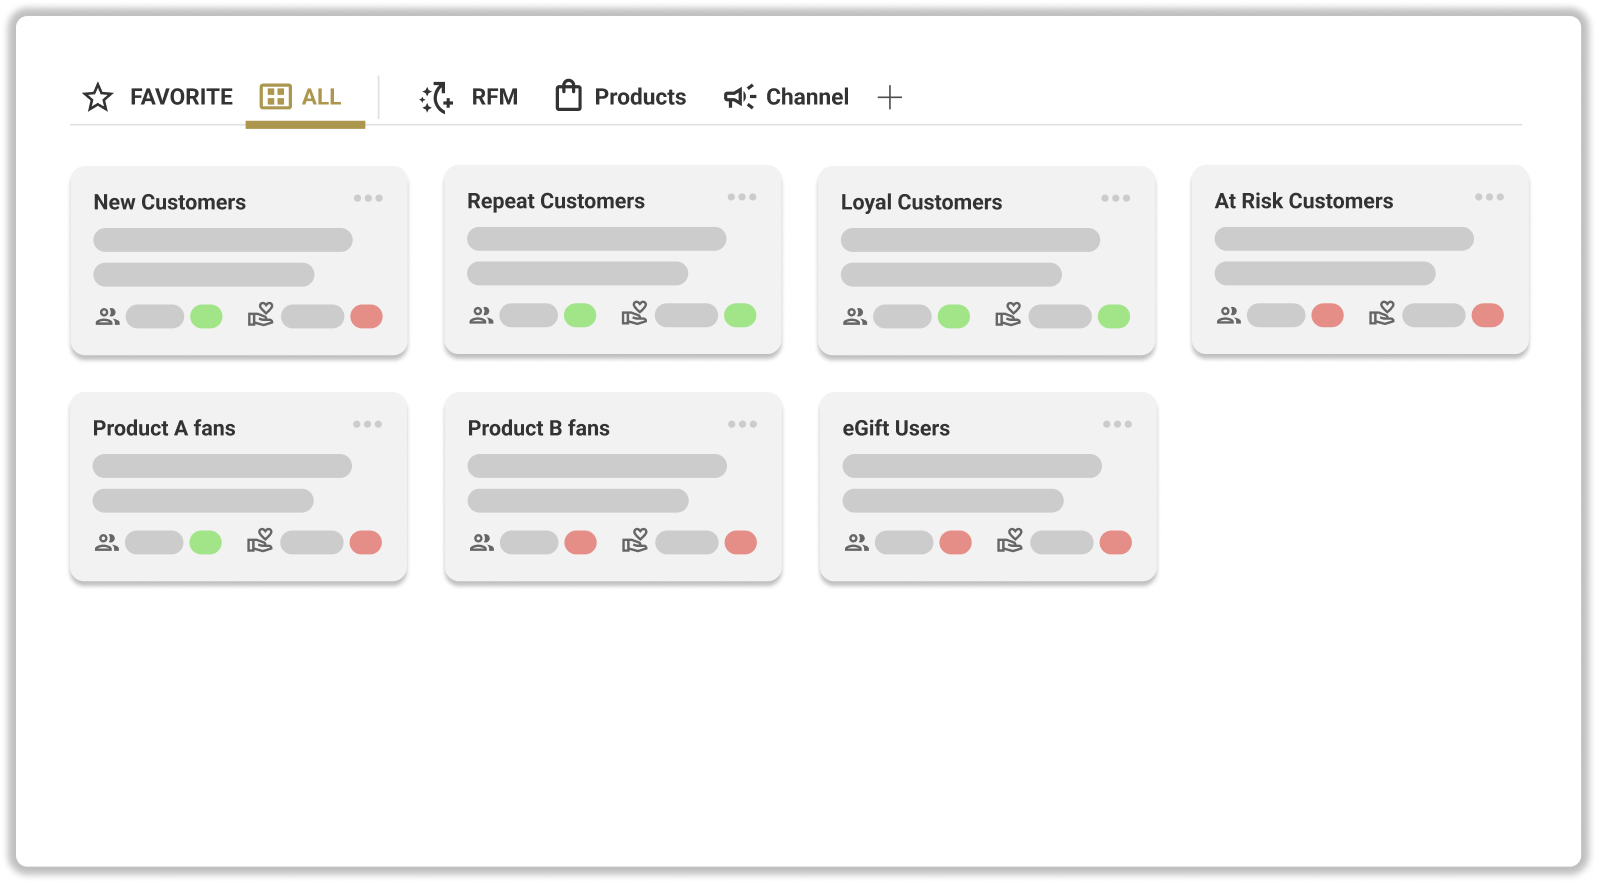
When creating customer segments, initial purchased products, types of products frequently purchased, acquisition channels, attributes, used coupon codes, and all other metrics related to customer attributes and behaviors can be candidates.
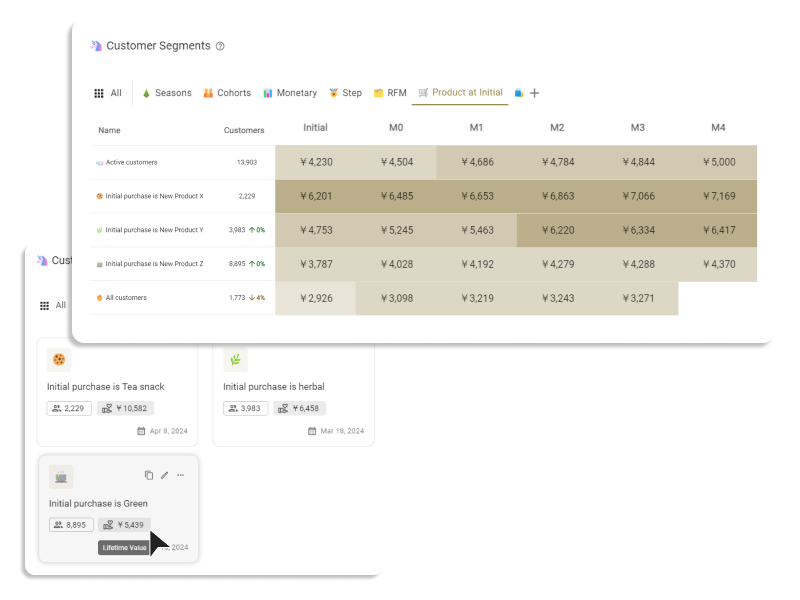
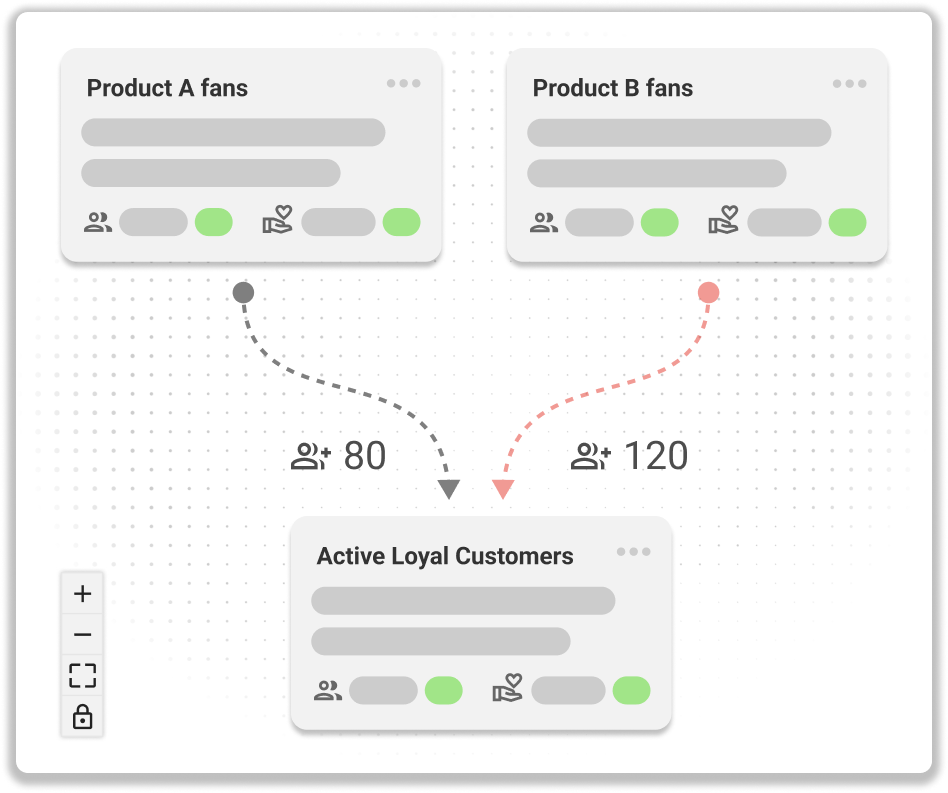
Let's consider two CLV cohorts as examples. The table above pertains to customers whose initial purchase was product A, while the table below concerns those who bought product B.
.png)
Let's compare some data points.
Product B, when compared to product A, has smaller sales from the initial order, but its CLV increases every month.
When comparing the 3-month CLV, product B is between 75 to 95 USD, whereas product A is around 60 to 75 USD. The segment with initial purchase product A seems to plateau after the 4th month.
This data suggests that when product B is initially purchased, sales are smaller in the short term, but it leads to higher sales in the long run.
However, this doesn't necessarily mean that product A should be removed from the product lineup. What this result indicates is that when allocating marketing resources, focusing more on product A can lead to quicker cash collection. On the other hand, focusing more on product B has a higher potential for a larger return on investment in the medium to long term.
For instance, if the goal is to enhance the medium to long-term investment returns, measures like promoting product B more in advertisements, leading it to initial purchases, or running email promotions for customers who haven't purchased product B can be considered.
Conclusion
In this article, we highlighted the challenges associated with the general method of calculating CLV from the perspectives of reliability and practicality, and introduced the method of cohort CLV analysis.
By tracking CLV over time and conducting cohort analysis across multiple customer segments, you can make decisions with a higher ROI in both the short and long terms.
We hope you find this method useful.
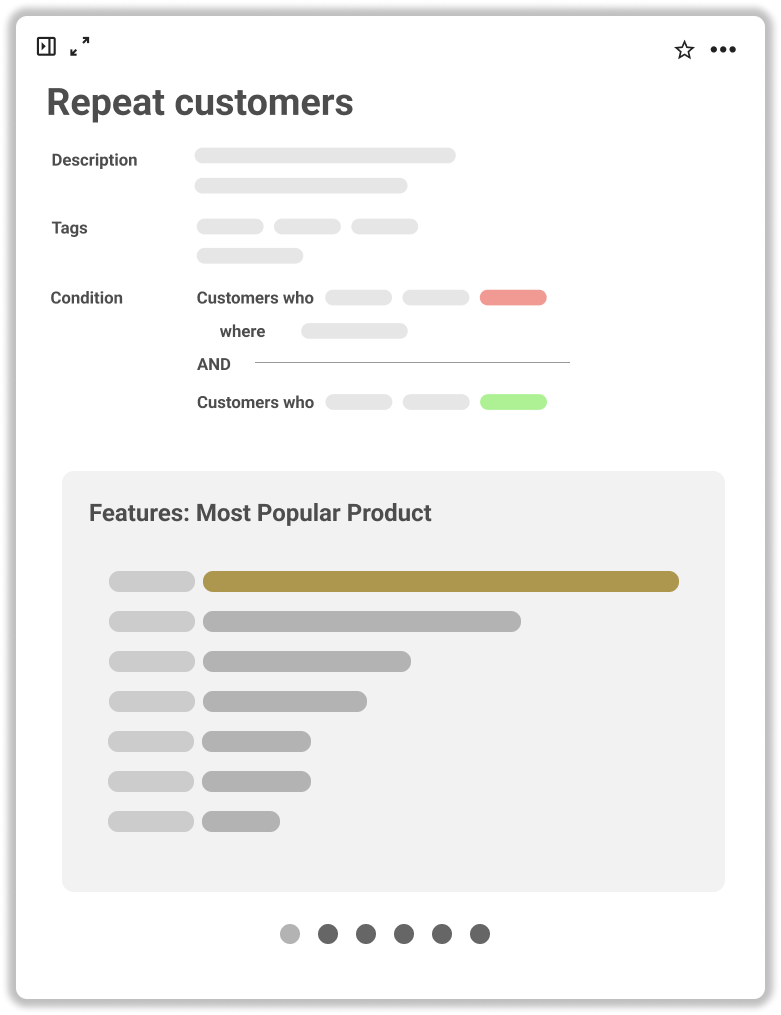
The customer segment tool for eCommerce marketers, ECPower, allows you to conduct cohort CLV analysis for individual segments with just one click. If you're interested, please check out the product site.