Introduction
In this series of articles, we will introduce steps to concretize actions towards improving CLV (Lifetime Value) by creating customer segments using ECPower. This guide will be beneficial for those who have just started using ECPower or are considering utilizing it.
In the previous article, we explained how to use the KPI analysis feature of ECPower to understand the current situation of the store using a cohort CLV table.
In this article, we will explain how to identify the bottlenecks for improving CLV by leveraging the KPI analysis function of ECPower.

Please see here for more details about ECPower, a customer segmentation tool for ecommerce marketers.
About the Components of CLV
Metrics that Constitute CLV
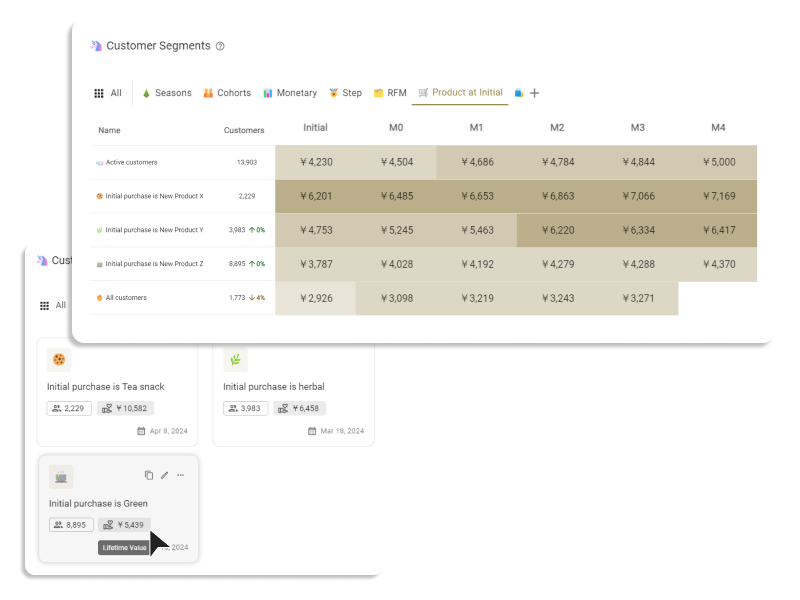
When considering how to improve CLV, it is crucial to first factorize what metrics CLV is composed of. Various methods of decomposition have been proposed, but ECPower adopts the following decomposition method.

ECPower displays the metrics underlined in addition to CLV for all customer segments created.


To improve CLV, it is essential first to understand CLV from the perspective of average purchase price, average purchase frequency, and repurchase interval, and identify where there is room for improvement. By increasing the price or the average purchase frequency, or by shortening the repurchase interval, the overall CLV of the store will be improved.
Identifying the Bottleneck for Improving CLV
Identify the Metrics to Focus on Using the 'KPI Analysis' Feature
We have explained that improving CLV requires improving metrics such as purchase price, purchase frequency, and repurchase interval. By using the 'KPI analysis' function of ECPower, you can identify where the bottlenecks are in each of these metrics.
Analyzing F2 Conversion Rate with Cohort Table
The first step to improve CLV is often about how to convert new customers (customers who have only made one purchase: F1 customers) into repeat customers (customers who have made more than two purchases: F2 customers and onwards).
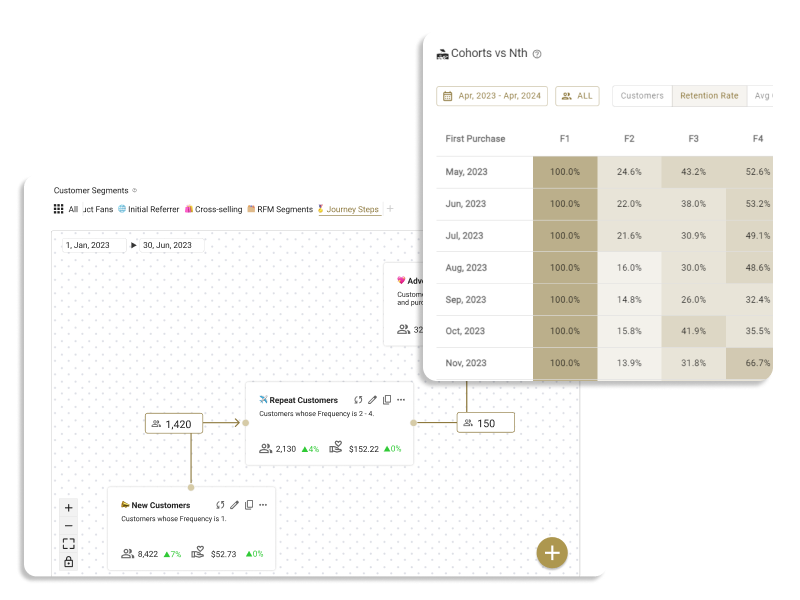
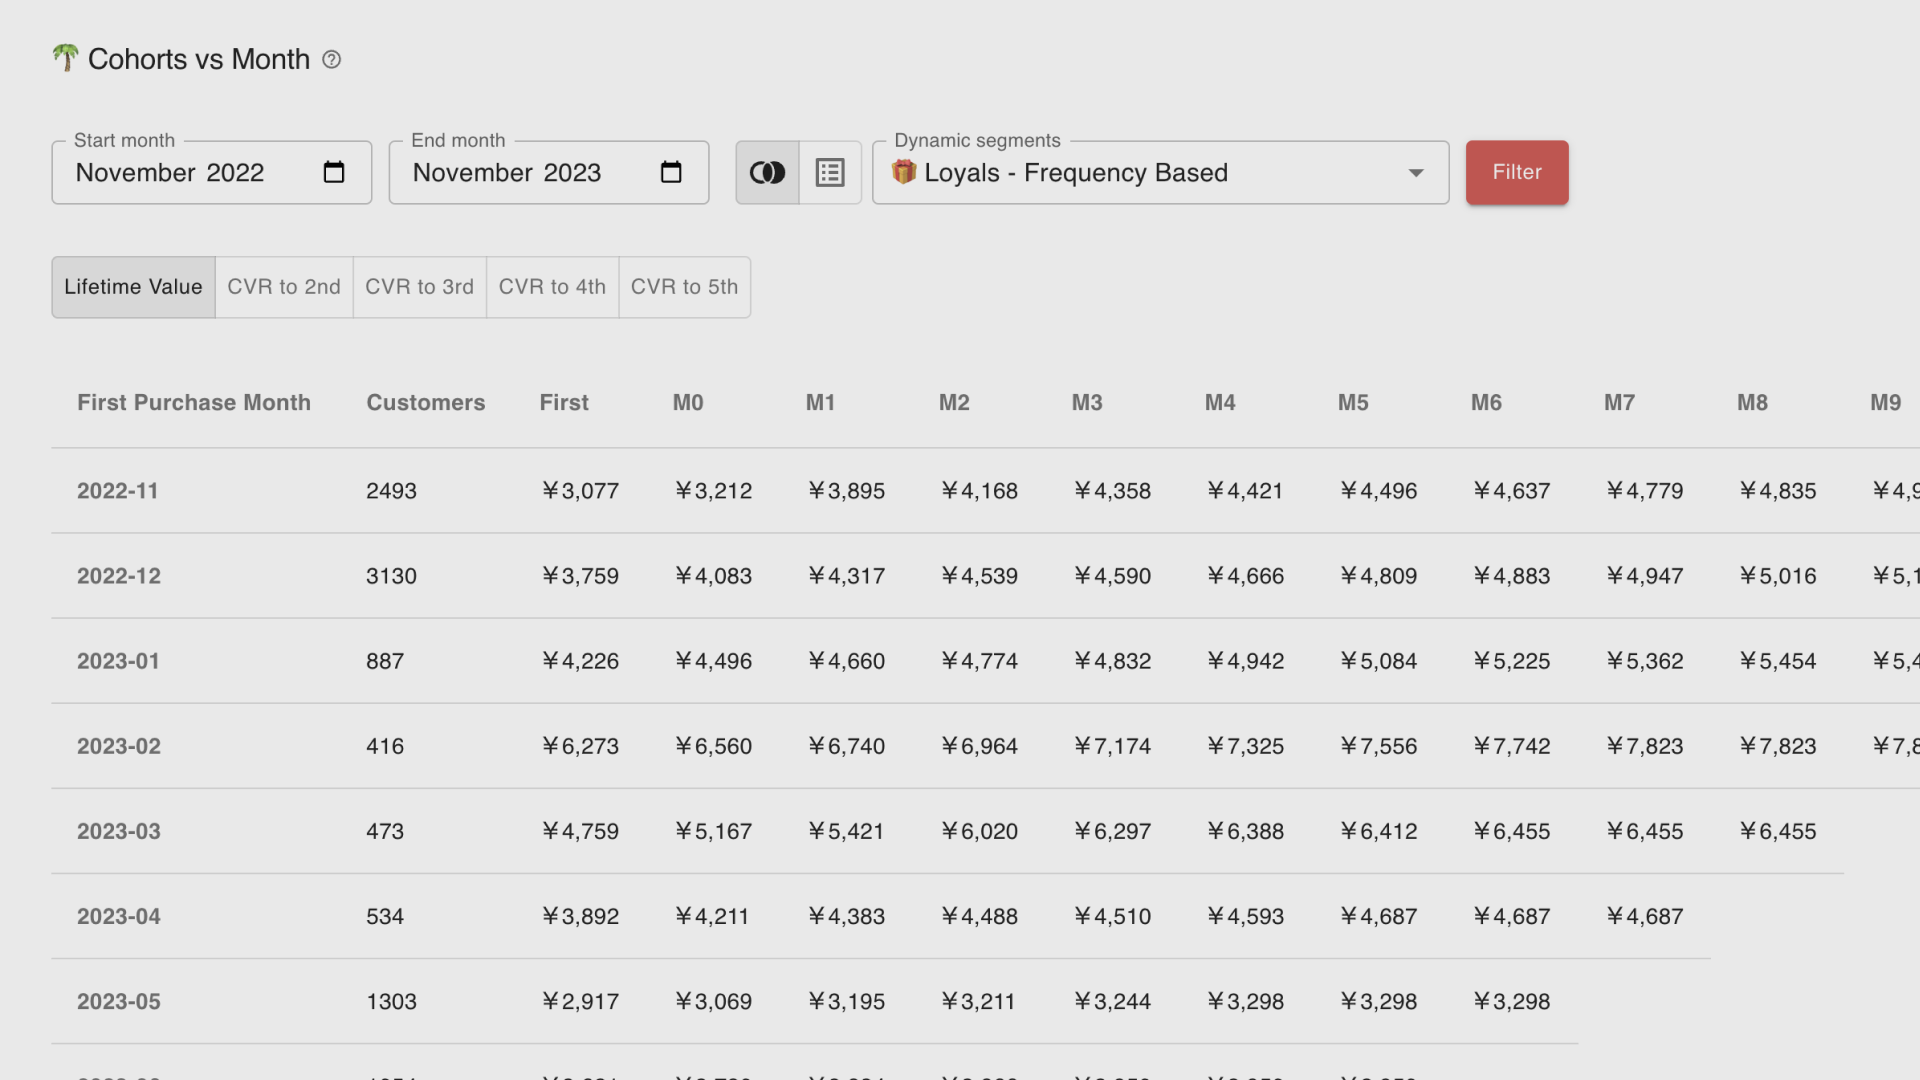
By navigating to KPI Analysis > Cohorts vs Month > CVR to 2nd, you will see a cohort analysis table for repeater conversion.

We've already covered the basics of how to read a cohort table in a previous article, but this allows you to analyze how long it takes to convert to F2 by each cohort.
In this example, while there is variability among cohorts, you can see things like, "F2 conversion peaks within 2-3 months," or "Comparing F2 conversion rates at 3 months, it seems to be gradually deteriorating."
In this store, it seems necessary to set goals like "increase F2 conversion rate within 3 months to 20%" and work on repeat measures for new customers.
Identifying the Bottleneck for Repeat Purchases
Once repeat customers are steadily increasing, the next thing to consider is how to increase the 'purchase frequency'.
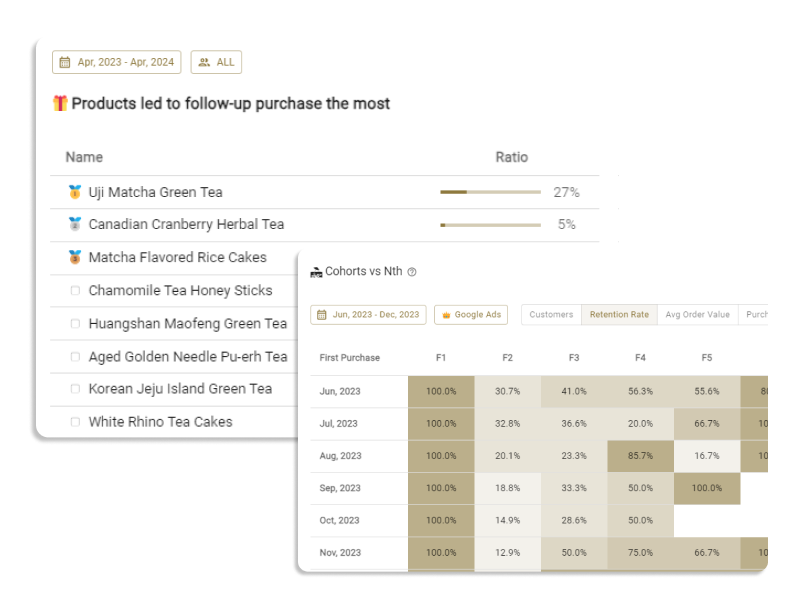
By going to KPI Analysis > Purchase Frequency Analysis > Continuation Rate, you will see a cohort table with purchase frequency (Fn) on the x-axis.
This table compiles data on what percentage of those who made a second purchase made a third purchase, and what percentage of those who made a third purchase made a fourth purchase, and so on, by each cohort.

Looking at the 'overall period' row for this store, you can see that repeat purchases are occurring at a relatively stable continuation rate from F4 onwards. On the other hand, the continuation rates for F2 and F3 are low, so these are identified as bottlenecks to address first.
It seems necessary to not only implement repeat strategies for first-time purchase customers, but also to take measures to encourage the next purchase for customers who have made a second purchase.
By analyzing the cohort table of retention rate in this way, we can identify the bottleneck in increasing the average number of purchases in the store.
Identifying Bottlenecks in Average Purchase Price
Let's consider the bottlenecks in the average purchase price.
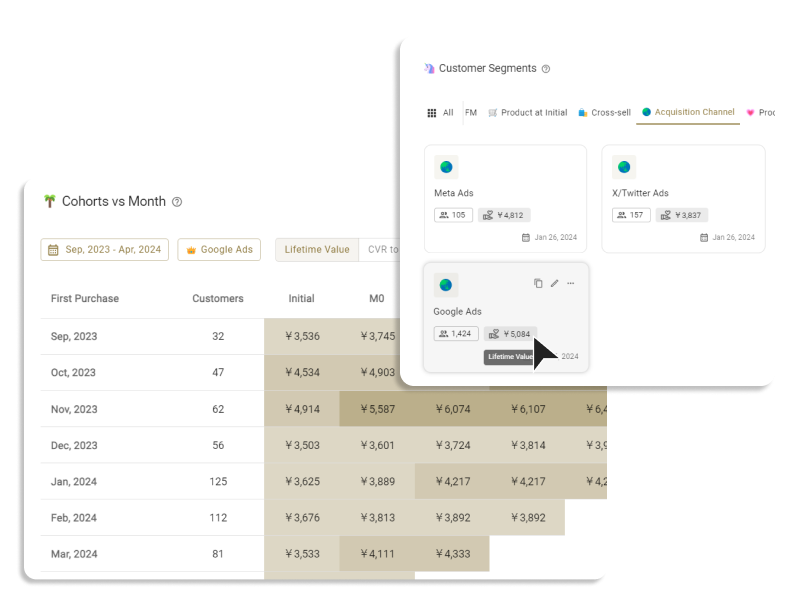
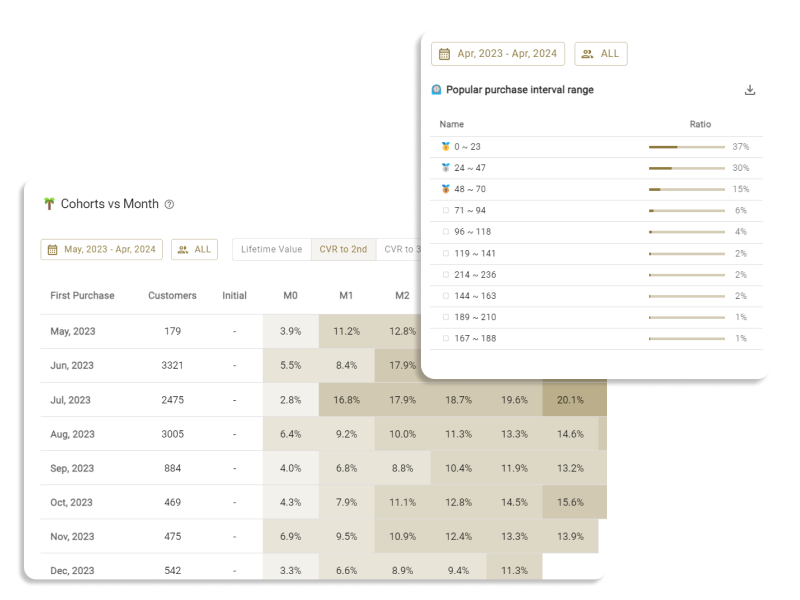
By proceeding with KPI analysis > Purchase number analysis > Average purchase price, a cohort table taking the purchase number (Fn) on the horizontal axis is displayed.
This table aggregates the average purchase price for the first purchase, second purchase, etc. for each cohort.

Looking at the "whole period" row, you can see that the average purchase price increases significantly up to F3. This store's "upsell strategy" and "cross-sell strategy" may be working. The data for F4 and onwards seems to be stable.
This case doesn't apply, but if the average purchase price drops significantly halfway, measures may be needed.
However, it could also be just a reflection of the store's product lineup and strategy, so you need to compare with the situation of your store and judge whether measures are necessary. For example, in the case of an e-commerce site for printer equipment, the initial purchase of the device itself is expensive, but the subsequent purchase of toner cartridges has a low unit price.
Conversely, if you actively adopt upsell and cross-sell strategies to increase the purchase price for repeat customers, whether the "average unit price has improved after F3" may become a KPI to monitor.
Identifying Bottlenecks in Repurchase Interval
Lastly, let's consider the bottlenecks in the repurchase interval.
By proceeding with KPI analysis > Purchase number analysis > Repurchase interval, a cohort table taking the purchase number (Fn) on the horizontal axis is displayed.
In this table, for F2, the average number of days from the first purchase, and for F3, the average number of days from the second purchase, are displayed on a cohort basis.

Looking at the "whole period" row, you can see that from F2 to F10, the repurchase interval shortens as the number of repeats increases. In this store's case, there isn't really a bottleneck problem, but it seems possible to set an aggressive goal, like shortening the repurchase interval for F3 and F4 to around 30 days.
Although it does not apply in this case, if there is a tendency for the repurchase interval to extend as the number of repeats increases, or if the repurchase interval for F3 is particularly long, it can be judged as a bottleneck that needs to be actively addressed to improve CLV.
In summary, we have explained how to use ECPower to identify bottlenecks in the store from the perspectives of purchase frequency, average purchase price, and repurchase interval for improving CLV.
Lastly, I would like to briefly explain what measures should be taken against each bottleneck.
Ideas for Improving Measures to Increase CLV
Improving Repeater Conversion Rate & Repeat Rate
Implementing "repeat measures for first-time purchase customers" is crucial.
For instance, based on the average F2 repurchase interval, let's try sending promotional emails to customers a certain period after their first purchase to encourage repeat purchases. If the response is not very good, measures such as distributing coupons might be effective.
In addition, immediately sending a thank-you email after the first purchase, introducing support content about product usage, and other methods can also be beneficial for improving the brand's impression.
Improving the Average Purchase Price
Incorporating "upsell and cross-sell measures" can be effective.
For example, to F3 to F5 customers who make regular repeat purchases, you can recommend products that can be used in combination with the purchased product, promote higher lineup products (more expensive products), and so on. If the response is not very good, distributing coupons and allowing them to experience first might be effective measures.
For more detailed explanations about upselling and cross-selling, refer to this article.
Improving the Repurchase Interval
Optimizing communication timing and increasing engagement through more contacts are important measures.
Optimizing Communication Timing
For example, if the goal is a 30-day repurchase interval, it might be effective to send emails every Friday specifically to customers who have passed 25 to 32 days since their last purchase.
The reason for using the term "optimization" is because it doesn't mean the more emails, the better. As a consumer, don't you feel a bit annoyed when too many emails are delivered, leading you to discard them without opening?
Taking communication at the right timing and with the right content based on the number of days since the last purchase is also an important element.
Increasing Contact to Enhance Engagement
Not only promotions but also messages and communications not aimed directly at sales can be effective for enhancing long-term engagement.
For example, sending messages that introduce the brand story of the store that customers can relate to, tips related to products that might interest them, content on how to use the products, etc.
If these communications work well, the impression of the brand will improve, and they will remember your brand more often, which could lead to shortening the repurchase interval in the long term.
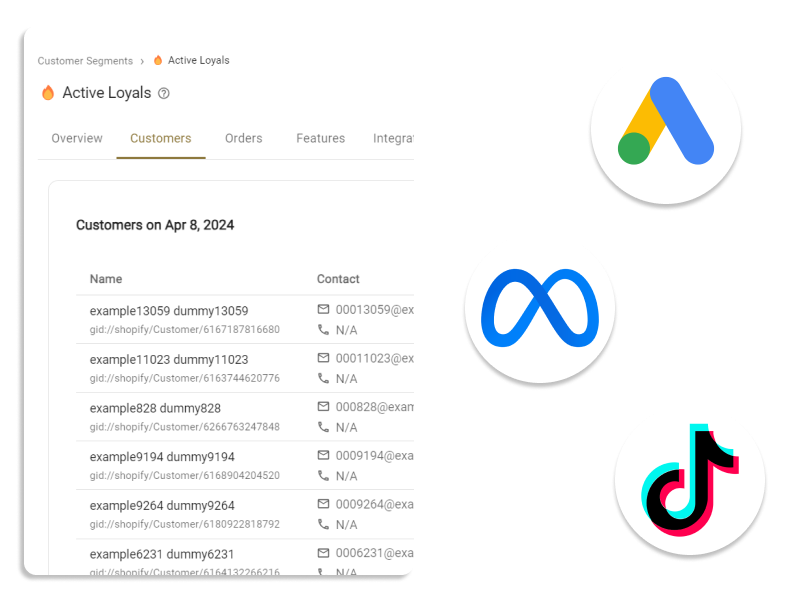
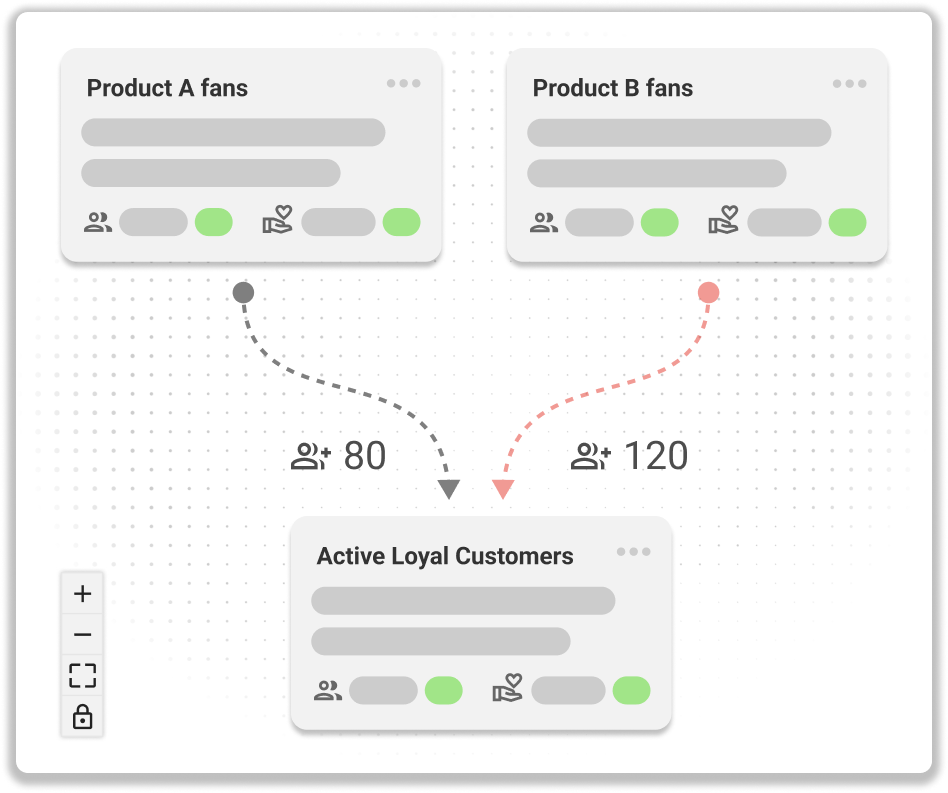
It's Important to Increase and Maintain Loyal Customers
Thank you for reading up to this point. Ultimately, improving the purchase price, purchase frequency, and repurchase interval for the purpose of increasing CLV will lead to the question of "how to increase and maintain 'loyal customers' and 'fans'".
However, how should we define loyal customers and fans in the first place? And what steps should be taken to increase loyal customers?
In the next article, we would like to focus on these points.